29
/fr/
fr
AIzaSyAYiBZKx7MnpbEhh9jyipgxe19OcubqV5w
April 1, 2024
167576
Kenya
KEN
true
2
1
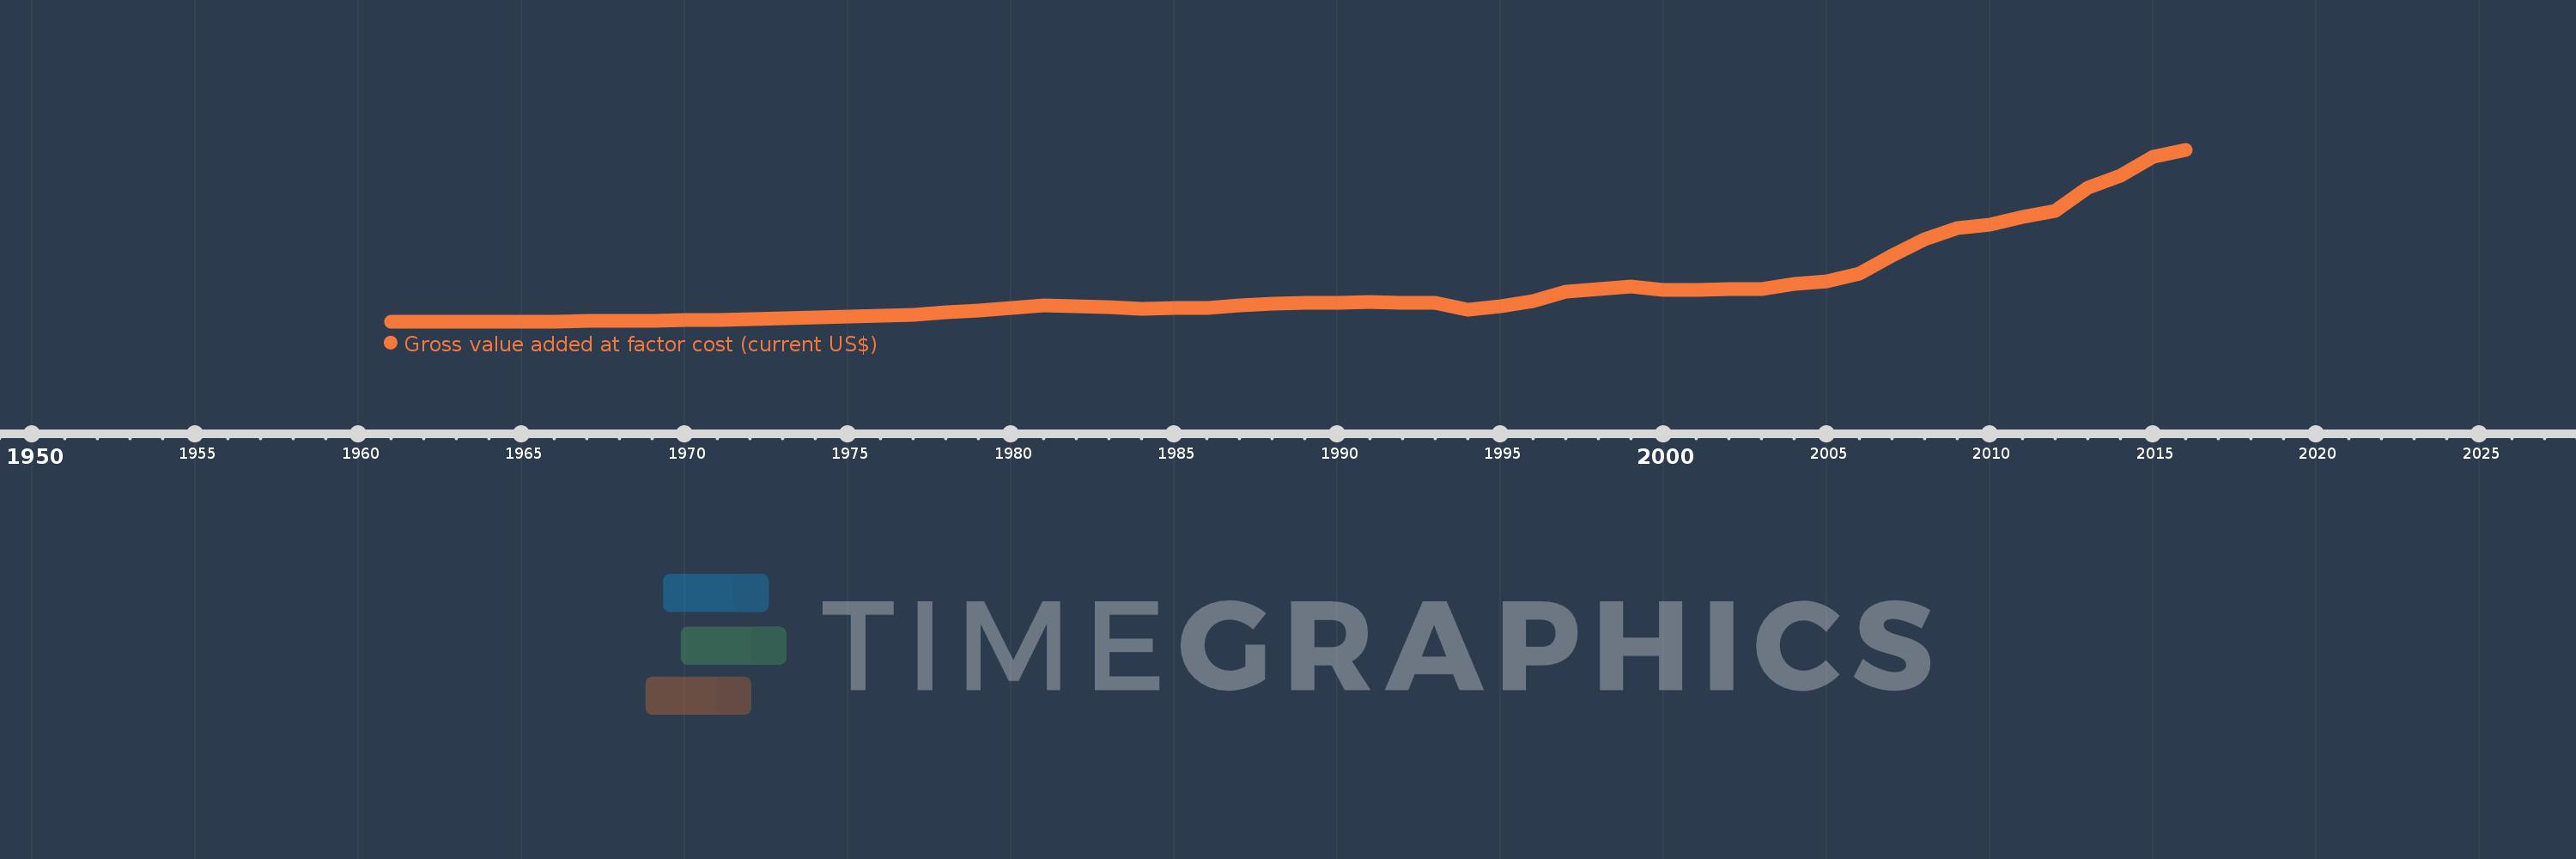
Gross value added at factor cost (current US$)
2016,2015,2014,2013,2012,2011,2010,2009,2008,2007,2006,2005,2004,2003,2002,2001,2000,1999,1998,1997,1996,1995,1994,1993,1992,1991,1990,1989,1988,1987,1986,1985,1984,1983,1982,1981,1980,1979,1978,1977,1976,1975,1974,1973,1972,1971,1970,1969,1968,1967,1966,1965,1964,1963,1962,1961
Cette statistique dans les autres pays:
AfghanistanAlbaniaAlgeriaAndorraAntigua and BarbudaArgentinaArmeniaArubaAustraliaAustriaAzerbaijanBahamas, TheBahrainBangladeshBarbadosBelarusBelgiumBelizeBeninBermudaBhutanBoliviaBosnia and HerzegovinaBotswanaBrazilBulgariaBurkina FasoBurundiCabo VerdeCambodiaCameroonCanadaCaribbean small statesCayman IslandsCentral African RepublicCentral Europe and the BalticsChadChileColombiaCongo, Dem. Rep.Costa RicaCroatiaCubaCyprusCzech RepublicDenmarkDjiboutiDominicaDominican RepublicEarly-demographic dividendEcuadorEgypt, Arab Rep.El SalvadorEquatorial GuineaEritreaEstoniaEthiopiaEuro areaEurope & Central AsiaEurope & Central Asia (excluding high income)Europe & Central Asia (IDA & IBRD countries)European UnionFaroe IslandsFijiFinlandFranceGabonGambia, TheGeorgiaGermanyGhanaGreeceGrenadaGuatemalaGuineaGuinea-BissauGuyanaHeavily indebted poor countries (HIPC)High incomeHondurasHong Kong SAR, ChinaHungaryIcelandIDA blendIDA onlyIDA totalIndiaIndonesiaIran, Islamic Rep.IrelandItalyJamaicaJapanJordanKazakhstanKenyaKiribatiKorea, Rep.KosovoKuwaitKyrgyz RepublicLao PDRLatin America & Caribbean Latin America & Caribbean (excluding high income)Latin America & the Caribbean (IDA & IBRD countries)LatviaLeast developed countries: UN classificationLebanonLesothoLiberiaLibyaLiechtensteinLithuaniaLow incomeLower middle incomeLuxembourgMacao SAR, ChinaMacedonia, FYRMadagascarMalawiMalaysiaMaldivesMaliMaltaMarshall IslandsMauritaniaMauritiusMexicoMicronesia, Fed. Sts.Middle East & North Africa (excluding high income)Middle East & North Africa (IDA & IBRD countries)MoldovaMongoliaMontenegroMoroccoMozambiqueNamibiaNepalNetherlandsNew ZealandNicaraguaNigeriaNorth AmericaNorwayOECD membersOmanPacific island small statesPakistanPalauPanamaPapua New GuineaParaguayPeruPolandPortugalPost-demographic dividendPre-demographic dividendRomaniaRussian FederationRwandaSao Tome and PrincipeSenegalSerbiaSeychellesSierra LeoneSingaporeSlovak RepublicSloveniaSolomon IslandsSouth AfricaSouth AsiaSouth Asia (IDA & IBRD)SpainSri LankaSt. Kitts and NevisSt. LuciaSt. Vincent and the GrenadinesSub-Saharan Africa Sub-Saharan Africa (excluding high income)Sub-Saharan Africa (IDA & IBRD countries)SudanSurinameSwazilandSwedenSwitzerlandSyrian Arab RepublicTajikistanTanzaniaThailandTimor-LesteTongaTrinidad and TobagoTunisiaTurkeyTurkmenistanTuvaluUgandaUkraineUnited KingdomUnited StatesUruguayUzbekistanVanuatuVenezuela, RBVietnamWest Bank and GazaWorldYemen, Rep.ZambiaZimbabwe La ligne de temps
Cette échelle de temps montre un graphique de 1961 année à 2016 année Kenya. Les données jusqu'à 1960 année ne sont pas présentés. Quantité d'observations actuelles selon dates: 56.
Source (désignation):
Les indicateurs du développement mondiale
Source (organisation):
World Bank national accounts data, and OECD National Accounts data files.
Catégories:
Economy & Growth
Dernière mise à jour
23 avr. 2017
Les indicateurs de changement de valeurs selon les années
Minimum:
732.339 mln.
1 janv. 1961
Maximum:
57.733 mds
1 janv. 2016
Pour la date d''observation
Valeur
Changement absolu
Le changement par rapport à la valeur précédente
1 janv. 1961
732.339 mln.
+732.339 mln.
0.0%
1 janv. 1962
733.893 mln.
+1.554 mln.
0.21%
1 janv. 1963
803.459 mln.
+69.566 mln.
9.48%
1 janv. 1964
857.569 mln.
+54.11 mln.
6.73%
1 janv. 1965
924.279 mln.
+66.71 mln.
7.78%
1 janv. 1966
916.943 mln.
-7.336 mln.
-0.79%
1 janv. 1967
1.067 mds
+150.164 mln.
16.38%
1 janv. 1968
1.136 mds
+69.16 mln.
6.48%
1 janv. 1969
1.24 mds
+103.852 mln.
9.14%
1 janv. 1970
1.334 mds
+93.604 mln.
7.55%
1 janv. 1971
1.453 mds
+119.308 mln.
8.95%
1 janv. 1972
1.596 mds
+143.136 mln.
9.85%
1 janv. 1973
1.929 mds
+332.472 mln.
20.83%
1 janv. 1974
2.249 mds
+320.526 mln.
16.62%
1 janv. 1975
2.632 mds
+382.44 mln.
17.0%
1 janv. 1976
2.879 mds
+247.797 mln.
9.42%
1 janv. 1977
3.055 mds
+175.643 mln.
6.1%
1 janv. 1978
3.965 mds
+909.646 mln.
29.78%
1 janv. 1979
4.606 mds
+641.188 mln.
16.17%
1 janv. 1980
5.44 mds
+833.897 mln.
18.11%
1 janv. 1981
6.195 mds
+755.217 mln.
13.88%
1 janv. 1982
5.879 mds
-316.24 mln.
-5.1%
1 janv. 1983
5.584 mds
-294.959 mln.
-5.02%
1 janv. 1984
5.219 mds
-364.808 mln.
-6.53%
1 janv. 1985
5.378 mds
+159.444 mln.
3.06%
1 janv. 1986
5.384 mds
+6.039 mln.
0.11%
1 janv. 1987
6.305 mds
+920.28 mln.
17.09%
1 janv. 1988
6.865 mds
+560.527 mln.
8.89%
1 janv. 1989
7.139 mds
+274.144 mln.
3.99%
1 janv. 1990
7.125 mds
-14.726 mln.
-0.21%
1 janv. 1991
7.351 mds
+226.672 mln.
3.18%
1 janv. 1992
7.045 mds
-306.55 mln.
-4.17%
1 janv. 1993
7.079 mds
+33.805 mln.
0.48%
1 janv. 1994
4.891 mds
-2.187 mds
-30.9%
1 janv. 1995
6.031 mds
+1.14 mds
23.31%
1 janv. 1996
7.656 mds
+1.625 mds
26.94%
1 janv. 1997
10.774 mds
+3.117 mds
40.71%
1 janv. 1998
11.753 mds
+979.319 mln.
9.09%
1 janv. 1999
12.521 mds
+767.694 mln.
6.53%
1 janv. 2000
11.447 mds
-1.074 mds
-8.58%
1 janv. 2001
11.276 mds
-171.058 mln.
-1.49%
1 janv. 2002
11.543 mds
+267.728 mln.
2.37%
1 janv. 2003
11.669 mds
+125.626 mln.
1.09%
1 janv. 2004
13.249 mds
+1.58 mds
13.54%
1 janv. 2005
14.308 mds
+1.06 mds
8.0%
1 janv. 2006
16.697 mds
+2.389 mds
16.69%
1 janv. 2007
22.885 mds
+6.188 mds
37.06%
1 janv. 2008
28.276 mds
+5.391 mds
23.56%
1 janv. 2009
31.969 mds
+3.693 mds
13.06%
1 janv. 2010
33.08 mds
+1.111 mds
3.48%
1 janv. 2011
35.685 mds
+2.605 mds
7.88%
1 janv. 2012
37.698 mds
+2.013 mds
5.64%
1 janv. 2013
45.299 mds
+7.601 mds
20.16%
1 janv. 2014
49.369 mds
+4.07 mds
8.99%
1 janv. 2015
55.419 mds
+6.05 mds
12.25%
1 janv. 2016
57.733 mds
+2.314 mds
4.18%
Classement des pays selon les statistiques actuelles par années


Commentaires: