29
/fr/
fr
AIzaSyAYiBZKx7MnpbEhh9jyipgxe19OcubqV5w
April 1, 2024
121008
Dominica
DMA
true
2
1
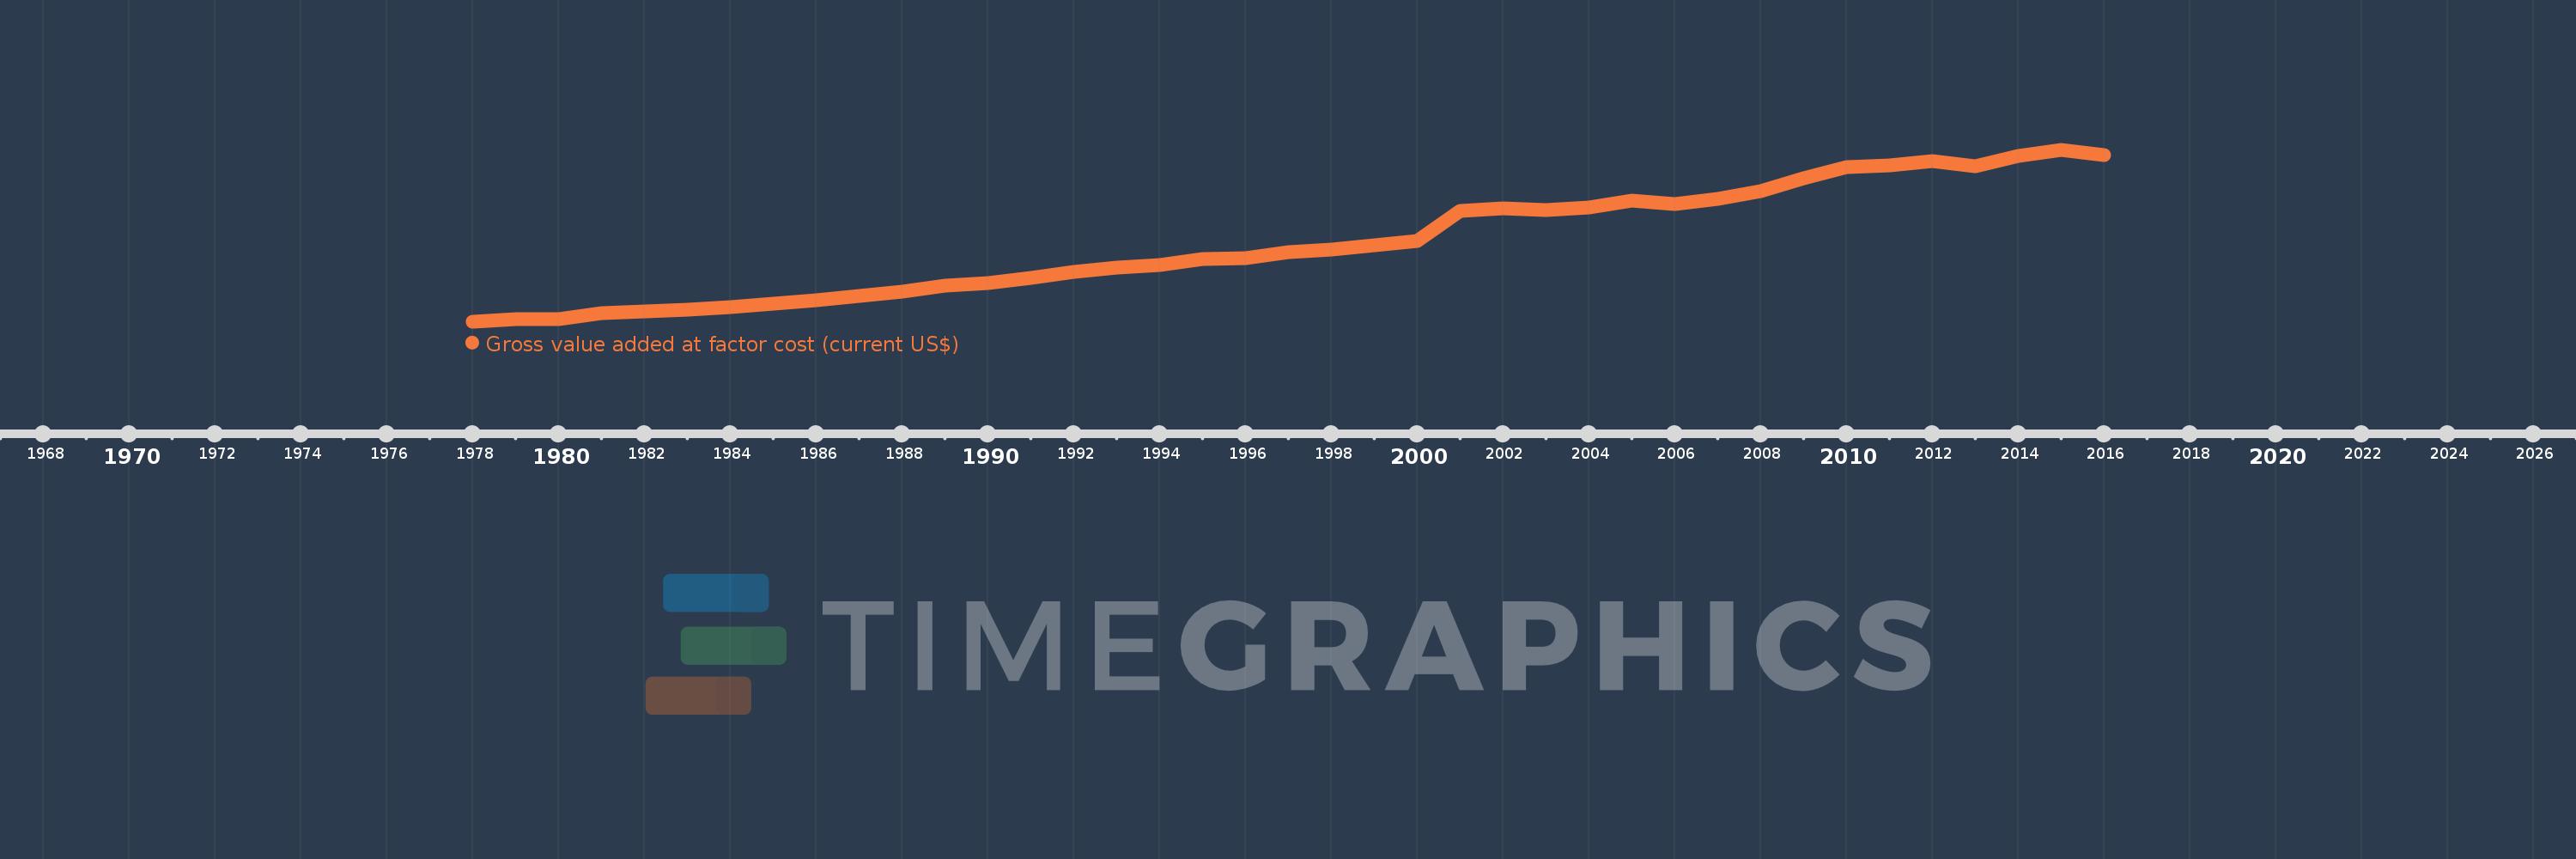
Gross value added at factor cost (current US$)
2016,2015,2014,2013,2012,2011,2010,2009,2008,2007,2006,2005,2004,2003,2002,2001,2000,1999,1998,1997,1996,1995,1994,1993,1992,1991,1990,1989,1988,1987,1986,1985,1984,1983,1982,1981,1980,1979,1978
Cette statistique dans les autres pays:
AfghanistanAlbaniaAlgeriaAndorraAntigua and BarbudaArgentinaArmeniaArubaAustraliaAustriaAzerbaijanBahamas, TheBahrainBangladeshBarbadosBelarusBelgiumBelizeBeninBermudaBhutanBoliviaBosnia and HerzegovinaBotswanaBrazilBulgariaBurkina FasoBurundiCabo VerdeCambodiaCameroonCanadaCaribbean small statesCayman IslandsCentral African RepublicCentral Europe and the BalticsChadChileColombiaCongo, Dem. Rep.Costa RicaCroatiaCubaCyprusCzech RepublicDenmarkDjiboutiDominicaDominican RepublicEarly-demographic dividendEcuadorEgypt, Arab Rep.El SalvadorEquatorial GuineaEritreaEstoniaEthiopiaEuro areaEurope & Central AsiaEurope & Central Asia (excluding high income)Europe & Central Asia (IDA & IBRD countries)European UnionFaroe IslandsFijiFinlandFranceGabonGambia, TheGeorgiaGermanyGhanaGreeceGrenadaGuatemalaGuineaGuinea-BissauGuyanaHeavily indebted poor countries (HIPC)High incomeHondurasHong Kong SAR, ChinaHungaryIcelandIDA blendIDA onlyIDA totalIndiaIndonesiaIran, Islamic Rep.IrelandItalyJamaicaJapanJordanKazakhstanKenyaKiribatiKorea, Rep.KosovoKuwaitKyrgyz RepublicLao PDRLatin America & Caribbean Latin America & Caribbean (excluding high income)Latin America & the Caribbean (IDA & IBRD countries)LatviaLeast developed countries: UN classificationLebanonLesothoLiberiaLibyaLiechtensteinLithuaniaLow incomeLower middle incomeLuxembourgMacao SAR, ChinaMacedonia, FYRMadagascarMalawiMalaysiaMaldivesMaliMaltaMarshall IslandsMauritaniaMauritiusMexicoMicronesia, Fed. Sts.Middle East & North Africa (excluding high income)Middle East & North Africa (IDA & IBRD countries)MoldovaMongoliaMontenegroMoroccoMozambiqueNamibiaNepalNetherlandsNew ZealandNicaraguaNigeriaNorth AmericaNorwayOECD membersOmanPacific island small statesPakistanPalauPanamaPapua New GuineaParaguayPeruPolandPortugalPost-demographic dividendPre-demographic dividendRomaniaRussian FederationRwandaSao Tome and PrincipeSenegalSerbiaSeychellesSierra LeoneSingaporeSlovak RepublicSloveniaSolomon IslandsSouth AfricaSouth AsiaSouth Asia (IDA & IBRD)SpainSri LankaSt. Kitts and NevisSt. LuciaSt. Vincent and the GrenadinesSub-Saharan Africa Sub-Saharan Africa (excluding high income)Sub-Saharan Africa (IDA & IBRD countries)SudanSurinameSwazilandSwedenSwitzerlandSyrian Arab RepublicTajikistanTanzaniaThailandTimor-LesteTongaTrinidad and TobagoTunisiaTurkeyTurkmenistanTuvaluUgandaUkraineUnited KingdomUnited StatesUruguayUzbekistanVanuatuVenezuela, RBVietnamWest Bank and GazaWorldYemen, Rep.ZambiaZimbabwe La ligne de temps
Cette échelle de temps montre un graphique de 1978 année à 2016 année Dominica. Les données jusqu'à 1977 année ne sont pas présentés. Quantité d'observations actuelles selon dates: 39.
Source (désignation):
Les indicateurs du développement mondiale
Source (organisation):
World Bank national accounts data, and OECD National Accounts data files.
Catégories:
Economy & Growth
Dernière mise à jour
23 avr. 2017
Les indicateurs de changement de valeurs selon les années
Minimum:
31.407 mln.
1 janv. 1978
Maximum:
444.083 mln.
1 janv. 2015
Pour la date d''observation
Valeur
Changement absolu
Le changement par rapport à la valeur précédente
1 janv. 1978
31.407 mln.
+31.407 mln.
0.0%
1 janv. 1979
39.233 mln.
+7.826 mln.
24.92%
1 janv. 1980
39.185 mln.
-48.148 milles
-0.12%
1 janv. 1981
53.237 mln.
+14.052 mln.
35.86%
1 janv. 1982
56.633 mln.
+3.396 mln.
6.38%
1 janv. 1983
60.593 mln.
+3.959 mln.
6.99%
1 janv. 1984
66.822 mln.
+6.23 mln.
10.28%
1 janv. 1985
75.07 mln.
+8.248 mln.
12.34%
1 janv. 1986
82.696 mln.
+7.626 mln.
10.16%
1 janv. 1987
93.804 mln.
+11.107 mln.
13.43%
1 janv. 1988
105.048 mln.
+11.244 mln.
11.99%
1 janv. 1989
118.23 mln.
+13.181 mln.
12.55%
1 janv. 1990
125.022 mln.
+6.793 mln.
5.75%
1 janv. 1991
136.978 mln.
+11.956 mln.
9.56%
1 janv. 1992
150.874 mln.
+13.896 mln.
10.14%
1 janv. 1993
161.433 mln.
+10.559 mln.
7.0%
1 janv. 1994
169.019 mln.
+7.585 mln.
4.7%
1 janv. 1995
182.985 mln.
+13.967 mln.
8.26%
1 janv. 1996
185.437 mln.
+2.452 mln.
1.34%
1 janv. 1997
199.07 mln.
+13.633 mln.
7.35%
1 janv. 1998
205.444 mln.
+6.374 mln.
3.2%
1 janv. 1999
216.681 mln.
+11.237 mln.
5.47%
1 janv. 2000
225.796 mln.
+9.115 mln.
4.21%
1 janv. 2001
297.975 mln.
+72.179 mln.
31.97%
1 janv. 2002
304.808 mln.
+6.833 mln.
2.29%
1 janv. 2003
299.264 mln.
-5.544 mln.
-1.82%
1 janv. 2004
306.016 mln.
+6.752 mln.
2.26%
1 janv. 2005
322.084 mln.
+16.069 mln.
5.25%
1 janv. 2006
314.074 mln.
-8.01 mln.
-2.49%
1 janv. 2007
327.01 mln.
+12.936 mln.
4.12%
1 janv. 2008
346.55 mln.
+19.54 mln.
5.98%
1 janv. 2009
376.131 mln.
+29.581 mln.
8.54%
1 janv. 2010
402.917 mln.
+26.786 mln.
7.12%
1 janv. 2011
407.117 mln.
+4.2 mln.
1.04%
1 janv. 2012
417.468 mln.
+10.351 mln.
2.54%
1 janv. 2013
405.833 mln.
-11.635 mln.
-2.79%
1 janv. 2014
429.464 mln.
+23.631 mln.
5.82%
1 janv. 2015
444.083 mln.
+14.619 mln.
3.4%
1 janv. 2016
431.655 mln.
-12.428 mln.
-2.8%
Classement des pays selon les statistiques actuelles par années


Commentaires: