29
/fr/
fr
AIzaSyAYiBZKx7MnpbEhh9jyipgxe19OcubqV5w
April 1, 2024
119947
Djibouti
DJI
true
2
1
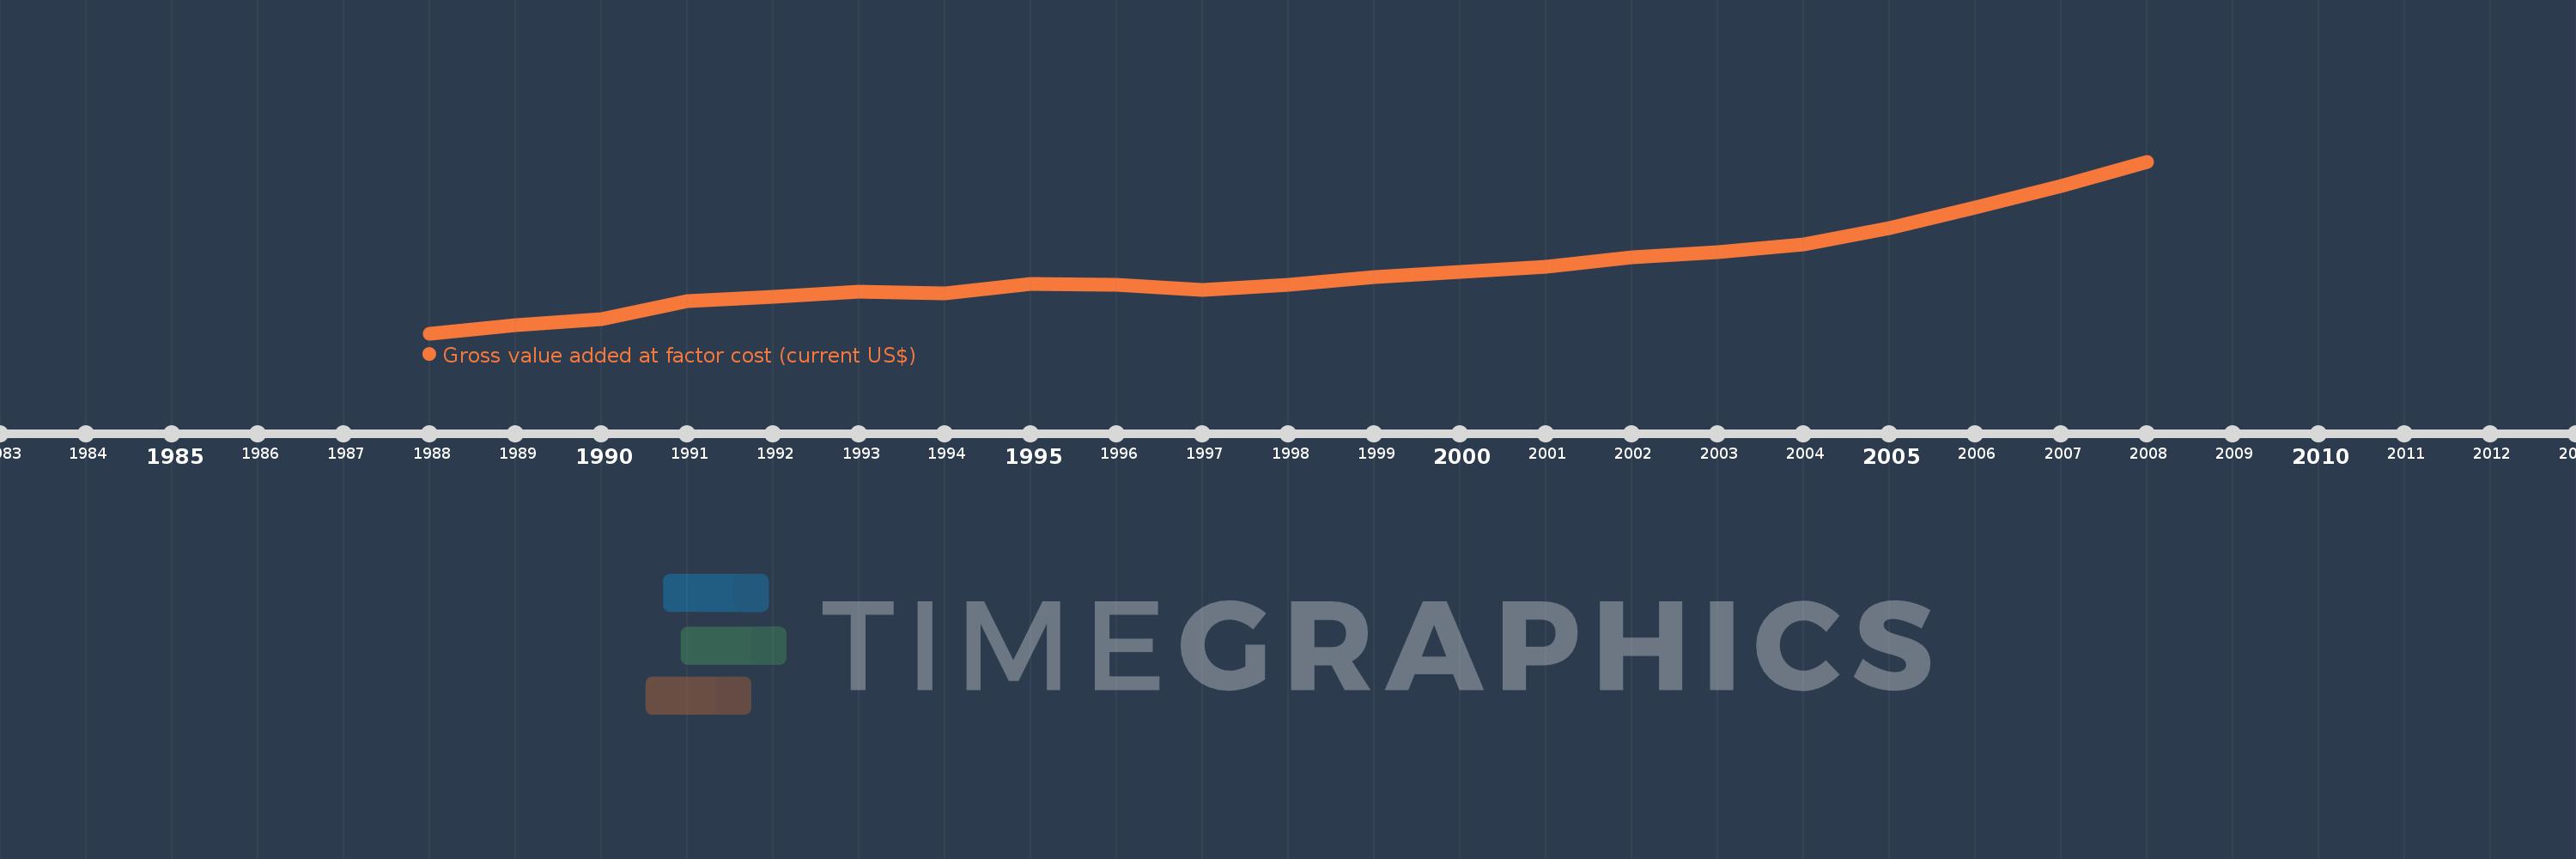
Gross value added at factor cost (current US$)
2008,2007,2006,2005,2004,2003,2002,2001,2000,1999,1998,1997,1996,1995,1994,1993,1992,1991,1990,1989,1988
Cette statistique dans les autres pays:
AfghanistanAlbaniaAlgeriaAndorraAntigua and BarbudaArgentinaArmeniaArubaAustraliaAustriaAzerbaijanBahamas, TheBahrainBangladeshBarbadosBelarusBelgiumBelizeBeninBermudaBhutanBoliviaBosnia and HerzegovinaBotswanaBrazilBulgariaBurkina FasoBurundiCabo VerdeCambodiaCameroonCanadaCaribbean small statesCayman IslandsCentral African RepublicCentral Europe and the BalticsChadChileColombiaCongo, Dem. Rep.Costa RicaCroatiaCubaCyprusCzech RepublicDenmarkDjiboutiDominicaDominican RepublicEarly-demographic dividendEcuadorEgypt, Arab Rep.El SalvadorEquatorial GuineaEritreaEstoniaEthiopiaEuro areaEurope & Central AsiaEurope & Central Asia (excluding high income)Europe & Central Asia (IDA & IBRD countries)European UnionFaroe IslandsFijiFinlandFranceGabonGambia, TheGeorgiaGermanyGhanaGreeceGrenadaGuatemalaGuineaGuinea-BissauGuyanaHeavily indebted poor countries (HIPC)High incomeHondurasHong Kong SAR, ChinaHungaryIcelandIDA blendIDA onlyIDA totalIndiaIndonesiaIran, Islamic Rep.IrelandItalyJamaicaJapanJordanKazakhstanKenyaKiribatiKorea, Rep.KosovoKuwaitKyrgyz RepublicLao PDRLatin America & Caribbean Latin America & Caribbean (excluding high income)Latin America & the Caribbean (IDA & IBRD countries)LatviaLeast developed countries: UN classificationLebanonLesothoLiberiaLibyaLiechtensteinLithuaniaLow incomeLower middle incomeLuxembourgMacao SAR, ChinaMacedonia, FYRMadagascarMalawiMalaysiaMaldivesMaliMaltaMarshall IslandsMauritaniaMauritiusMexicoMicronesia, Fed. Sts.Middle East & North Africa (excluding high income)Middle East & North Africa (IDA & IBRD countries)MoldovaMongoliaMontenegroMoroccoMozambiqueNamibiaNepalNetherlandsNew ZealandNicaraguaNigeriaNorth AmericaNorwayOECD membersOmanPacific island small statesPakistanPalauPanamaPapua New GuineaParaguayPeruPolandPortugalPost-demographic dividendPre-demographic dividendRomaniaRussian FederationRwandaSao Tome and PrincipeSenegalSerbiaSeychellesSierra LeoneSingaporeSlovak RepublicSloveniaSolomon IslandsSouth AfricaSouth AsiaSouth Asia (IDA & IBRD)SpainSri LankaSt. Kitts and NevisSt. LuciaSt. Vincent and the GrenadinesSub-Saharan Africa Sub-Saharan Africa (excluding high income)Sub-Saharan Africa (IDA & IBRD countries)SudanSurinameSwazilandSwedenSwitzerlandSyrian Arab RepublicTajikistanTanzaniaThailandTimor-LesteTongaTrinidad and TobagoTunisiaTurkeyTurkmenistanTuvaluUgandaUkraineUnited KingdomUnited StatesUruguayUzbekistanVanuatuVenezuela, RBVietnamWest Bank and GazaWorldYemen, Rep.ZambiaZimbabwe La ligne de temps
Cette échelle de temps montre un graphique de 1988 année à 2008 année Djibouti. Les données jusqu'à 1987 année ne sont pas présentés. Quantité d'observations actuelles selon dates: 21.
Source (désignation):
Les indicateurs du développement mondiale
Source (organisation):
World Bank national accounts data, and OECD National Accounts data files.
Catégories:
Economy & Growth
Dernière mise à jour
23 avr. 2017
Les indicateurs de changement de valeurs selon les années
Minimum:
313.565 mln.
1 janv. 1988
Maximum:
747.267 mln.
1 janv. 2008
Pour la date d''observation
Valeur
Changement absolu
Le changement par rapport à la valeur précédente
1 janv. 1988
313.565 mln.
+313.565 mln.
0.0%
1 janv. 1989
334.755 mln.
+21.191 mln.
6.76%
1 janv. 1990
350.133 mln.
+15.378 mln.
4.59%
1 janv. 1991
394.727 mln.
+44.593 mln.
12.74%
1 janv. 1992
404.82 mln.
+10.094 mln.
2.56%
1 janv. 1993
418.701 mln.
+13.881 mln.
3.43%
1 janv. 1994
414.428 mln.
-4.273 mln.
-1.02%
1 janv. 1995
437.267 mln.
+22.839 mln.
5.51%
1 janv. 1996
435.998 mln.
-1.269 mln.
-0.29%
1 janv. 1997
422.409 mln.
-13.589 mln.
-3.12%
1 janv. 1998
436.291 mln.
+13.881 mln.
3.29%
1 janv. 1999
456.114 mln.
+19.823 mln.
4.54%
1 janv. 2000
468.723 mln.
+12.61 mln.
2.76%
1 janv. 2001
481.363 mln.
+12.639 mln.
2.7%
1 janv. 2002
505.357 mln.
+23.994 mln.
4.98%
1 janv. 2003
517.464 mln.
+12.107 mln.
2.4%
1 janv. 2004
538.789 mln.
+21.326 mln.
4.12%
1 janv. 2005
579.746 mln.
+40.956 mln.
7.6%
1 janv. 2006
630.544 mln.
+50.798 mln.
8.76%
1 janv. 2007
685.659 mln.
+55.115 mln.
8.74%
1 janv. 2008
747.267 mln.
+61.608 mln.
8.99%
Classement des pays selon les statistiques actuelles par années


Commentaires: