29
/fr/
fr
AIzaSyAYiBZKx7MnpbEhh9jyipgxe19OcubqV5w
April 1, 2024
147600
Guyana
GUY
true
2
1
Adjusted savings: gross savings (% of GNI)
2015,2014,2013,2012,2011,2010,2009,2008,2007,2006,2005,2004,2003,2002,2001,2000,1999,1998,1997,1996,1995,1994,1993,1986,1985,1984,1983,1982,1981,1980,1979,1978
Cette statistique dans les autres pays:
AfghanistanAlbaniaAlgeriaAngolaAntigua and BarbudaArab WorldArgentinaArmeniaAustraliaAustriaAzerbaijanBahamas, TheBahrainBangladeshBarbadosBelarusBelgiumBelizeBeninBermudaBhutanBoliviaBosnia and HerzegovinaBotswanaBrazilBrunei DarussalamBulgariaBurkina FasoBurundiCabo VerdeCambodiaCameroonCanadaCaribbean small statesCentral African RepublicCentral Europe and the BalticsChadChileChinaColombiaComorosCongo, Dem. Rep.Congo, Rep.Costa RicaCote d'IvoireCroatiaCyprusCzech RepublicDenmarkDjiboutiDominicaDominican RepublicEarly-demographic dividendEast Asia & PacificEast Asia & Pacific (excluding high income)East Asia & Pacific (IDA & IBRD countries)EcuadorEgypt, Arab Rep.El SalvadorEquatorial GuineaEritreaEstoniaEthiopiaEuro areaEurope & Central AsiaEurope & Central Asia (excluding high income)Europe & Central Asia (IDA & IBRD countries)European UnionFaroe IslandsFijiFinlandFragile and conflict affected situationsFranceGabonGambia, TheGeorgiaGermanyGhanaGreeceGrenadaGuatemalaGuineaGuinea-BissauGuyanaHaitiHeavily indebted poor countries (HIPC)High incomeHondurasHong Kong SAR, ChinaHungaryIBRD onlyIcelandIDA & IBRD totalIDA blendIDA onlyIDA totalIndiaIndonesiaIran, Islamic Rep.IraqIrelandIsraelItalyJamaicaJapanJordanKazakhstanKenyaKiribatiKorea, Rep.KosovoKuwaitKyrgyz RepublicLao PDRLate-demographic dividendLatin America & Caribbean Latin America & Caribbean (excluding high income)Latin America & the Caribbean (IDA & IBRD countries)LatviaLeast developed countries: UN classificationLebanonLesothoLiberiaLibyaLithuaniaLow & middle incomeLow incomeLower middle incomeLuxembourgMacao SAR, ChinaMacedonia, FYRMadagascarMalawiMalaysiaMaldivesMaliMaltaMauritaniaMauritiusMexicoMiddle East & North AfricaMiddle East & North Africa (excluding high income)Middle East & North Africa (IDA & IBRD countries)Middle incomeMoldovaMongoliaMontenegroMoroccoMozambiqueNamibiaNepalNetherlandsNew ZealandNicaraguaNigerNigeriaNorth AmericaNorwayOECD membersOmanOther small statesPacific island small statesPakistanPanamaPapua New GuineaParaguayPeruPhilippinesPolandPortugalPost-demographic dividendPre-demographic dividendQatarRomaniaRussian FederationRwandaSaudi ArabiaSenegalSerbiaSeychellesSierra LeoneSingaporeSlovak RepublicSloveniaSmall statesSolomon IslandsSouth AfricaSouth AsiaSouth Asia (IDA & IBRD)SpainSri LankaSt. Kitts and NevisSt. LuciaSt. Vincent and the GrenadinesSub-Saharan Africa Sub-Saharan Africa (excluding high income)Sub-Saharan Africa (IDA & IBRD countries)SudanSurinameSwazilandSwedenSwitzerlandSyrian Arab RepublicTajikistanTanzaniaThailandTimor-LesteTogoTongaTrinidad and TobagoTunisiaTurkeyTurkmenistanUgandaUkraineUnited KingdomUnited StatesUpper middle incomeUruguayVanuatuVenezuela, RBVietnamWest Bank and GazaWorldYemen, Rep.ZambiaZimbabwe La ligne de temps
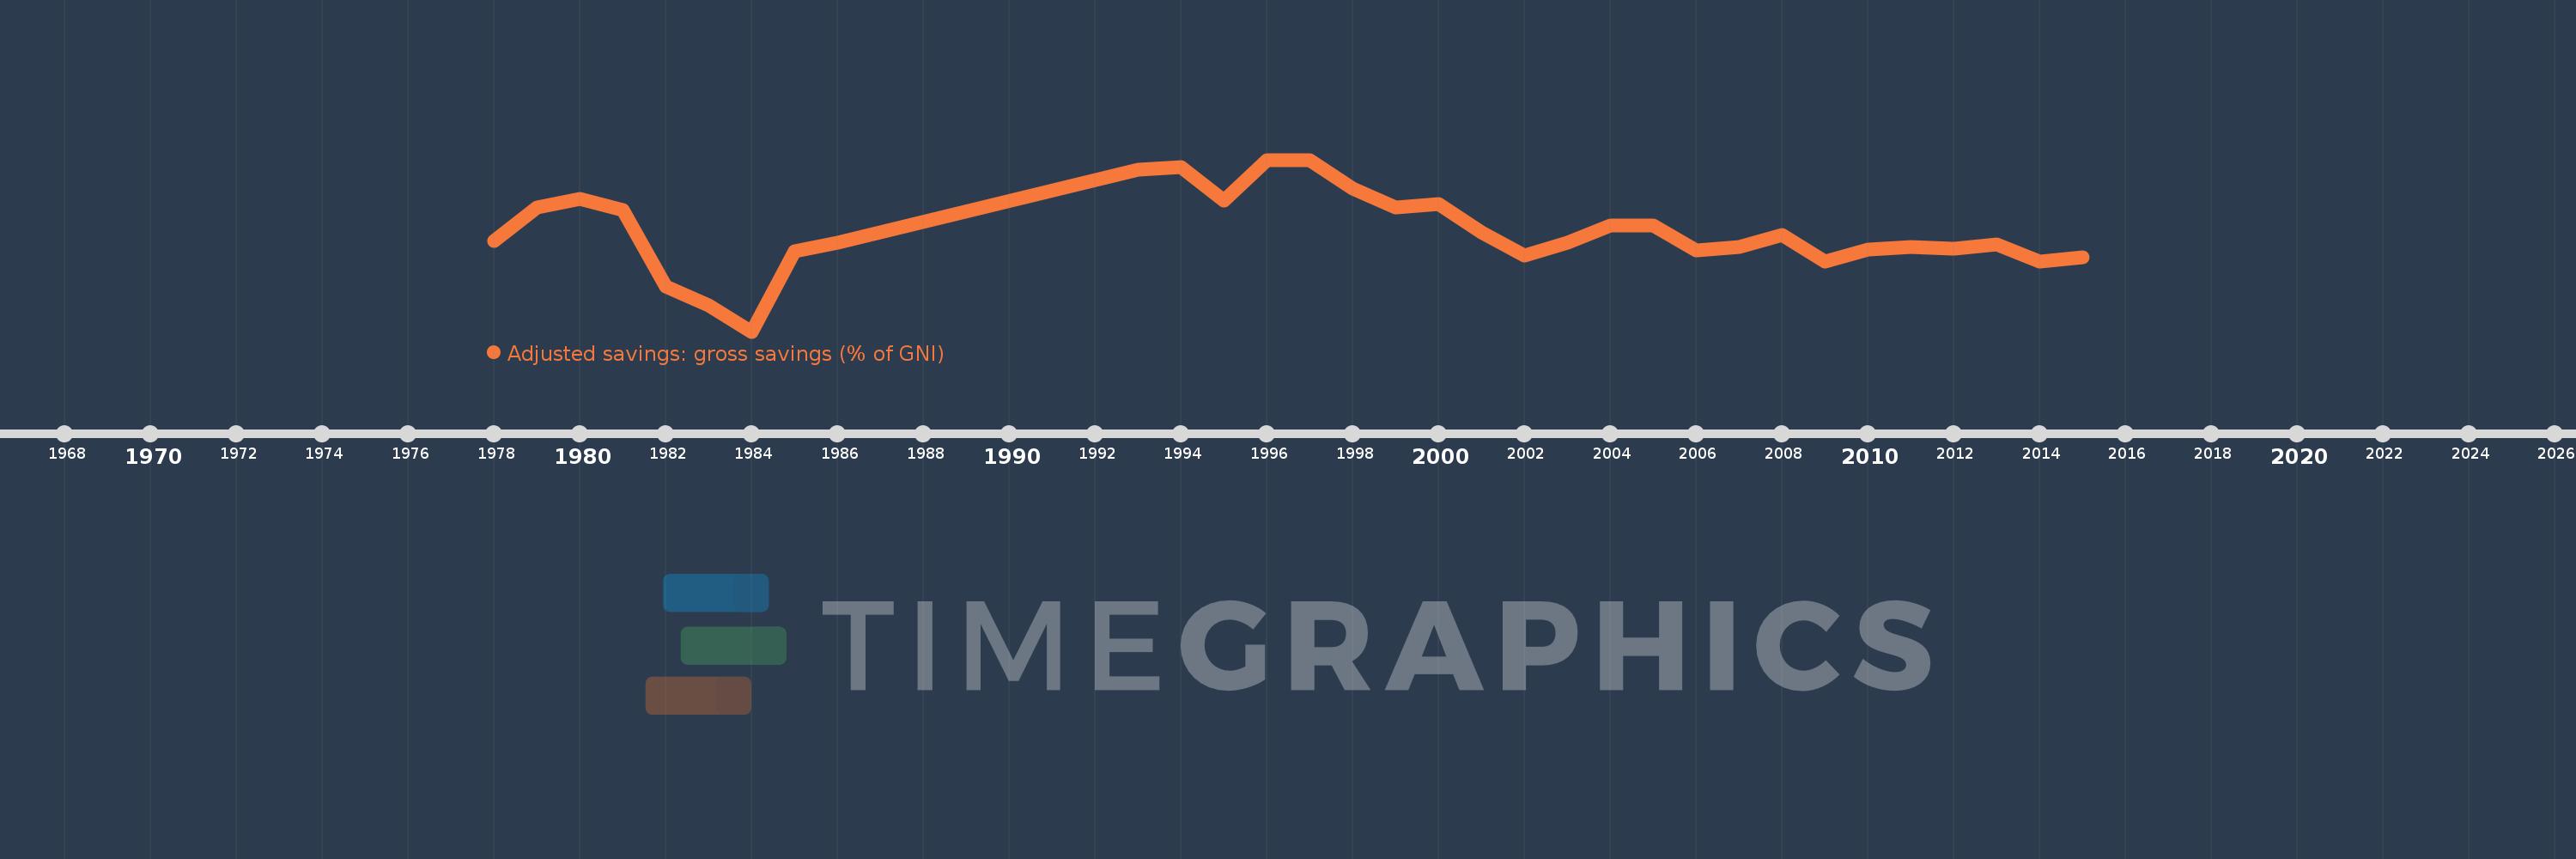
Cette échelle de temps montre un graphique de 1978 année à 2015 année Guyana. Les données jusqu'à 1977 année ne sont pas présentés. Quantité d'observations actuelles selon dates: 32.
Source (désignation):
Les indicateurs du développement mondiale
Source (organisation):
World Bank national accounts data files.
Catégories:
Economy & Growth, Environment
Dernière mise à jour
23 avr. 2017
Les indicateurs de changement de valeurs selon les années
Minimum:
-13.701
1 janv. 1984
Maximum:
25.817
1 janv. 1996
Pour la date d''observation
Valeur
Changement absolu
Le changement par rapport à la valeur précédente
1 janv. 1978
7.092
+7.092
0.0%
1 janv. 1979
14.88
+7.788
109.82%
1 janv. 1980
16.812
+1.932
12.98%
1 janv. 1981
14.308
-2.504
-14.89%
1 janv. 1982
-3.305
-17.612
-123.1%
1 janv. 1983
-7.733
-4.428
134.01%
1 janv. 1984
-13.701
-5.969
77.18%
1 janv. 1985
4.767
+18.468
-134.79%
1 janv. 1986
6.74
+1.973
41.39%
1 janv. 1993
23.642
+16.901
250.76%
1 janv. 1994
24.083
+0.442
1.87%
1 janv. 1995
16.526
-7.558
-31.38%
1 janv. 1996
25.817
+9.292
56.23%
1 janv. 1997
25.783
-0.034
-0.13%
1 janv. 1998
19.196
-6.588
-25.55%
1 janv. 1999
14.796
-4.399
-22.92%
1 janv. 2000
15.696
+0.9
6.08%
1 janv. 2001
9.117
-6.579
-41.92%
1 janv. 2002
3.781
-5.336
-58.53%
1 janv. 2003
6.674
+2.893
76.52%
1 janv. 2004
10.725
+4.051
60.69%
1 janv. 2005
10.622
-0.103
-0.96%
1 janv. 2006
4.921
-5.701
-53.67%
1 janv. 2007
5.733
+0.811
16.48%
1 janv. 2008
8.61
+2.877
50.19%
1 janv. 2009
2.399
-6.21
-72.13%
1 janv. 2010
5.094
+2.695
112.3%
1 janv. 2011
5.787
+0.693
13.61%
1 janv. 2012
5.327
-0.46
-7.95%
1 janv. 2013
6.342
+1.015
19.05%
1 janv. 2014
2.497
-3.844
-60.62%
1 janv. 2015
3.367
+0.869
34.81%
Classement des pays selon les statistiques actuelles par années


Commentaires: