29
/fr/
fr
AIzaSyAYiBZKx7MnpbEhh9jyipgxe19OcubqV5w
April 1, 2024
141502
Greece
GRC
true
2
1
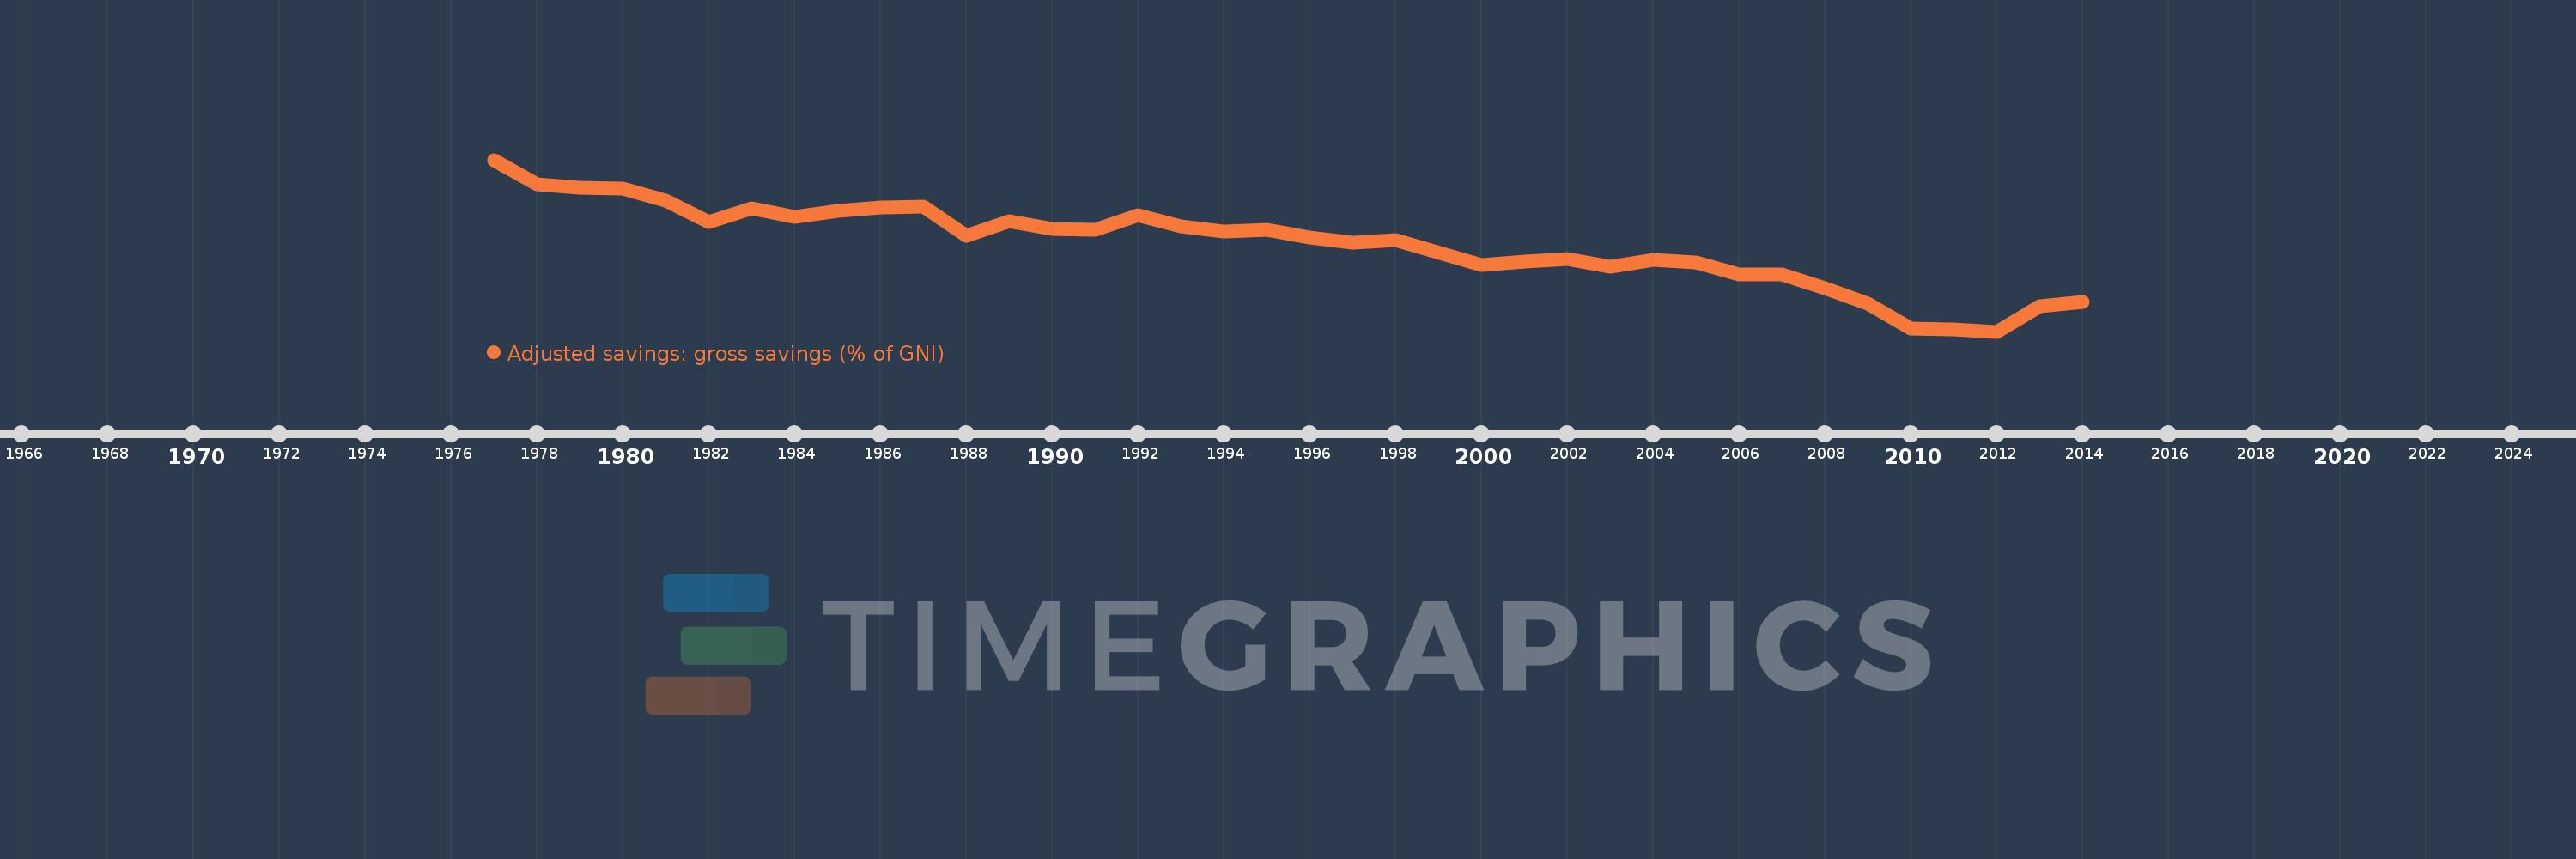
Adjusted savings: gross savings (% of GNI)
2014,2013,2012,2011,2010,2009,2008,2007,2006,2005,2004,2003,2002,2001,2000,1998,1997,1996,1995,1994,1993,1992,1991,1990,1989,1988,1987,1986,1985,1984,1983,1982,1981,1980,1979,1978,1977
Cette statistique dans les autres pays:
AfghanistanAlbaniaAlgeriaAngolaAntigua and BarbudaArab WorldArgentinaArmeniaAustraliaAustriaAzerbaijanBahamas, TheBahrainBangladeshBarbadosBelarusBelgiumBelizeBeninBermudaBhutanBoliviaBosnia and HerzegovinaBotswanaBrazilBrunei DarussalamBulgariaBurkina FasoBurundiCabo VerdeCambodiaCameroonCanadaCaribbean small statesCentral African RepublicCentral Europe and the BalticsChadChileChinaColombiaComorosCongo, Dem. Rep.Congo, Rep.Costa RicaCote d'IvoireCroatiaCyprusCzech RepublicDenmarkDjiboutiDominicaDominican RepublicEarly-demographic dividendEast Asia & PacificEast Asia & Pacific (excluding high income)East Asia & Pacific (IDA & IBRD countries)EcuadorEgypt, Arab Rep.El SalvadorEquatorial GuineaEritreaEstoniaEthiopiaEuro areaEurope & Central AsiaEurope & Central Asia (excluding high income)Europe & Central Asia (IDA & IBRD countries)European UnionFaroe IslandsFijiFinlandFragile and conflict affected situationsFranceGabonGambia, TheGeorgiaGermanyGhanaGreeceGrenadaGuatemalaGuineaGuinea-BissauGuyanaHaitiHeavily indebted poor countries (HIPC)High incomeHondurasHong Kong SAR, ChinaHungaryIBRD onlyIcelandIDA & IBRD totalIDA blendIDA onlyIDA totalIndiaIndonesiaIran, Islamic Rep.IraqIrelandIsraelItalyJamaicaJapanJordanKazakhstanKenyaKiribatiKorea, Rep.KosovoKuwaitKyrgyz RepublicLao PDRLate-demographic dividendLatin America & Caribbean Latin America & Caribbean (excluding high income)Latin America & the Caribbean (IDA & IBRD countries)LatviaLeast developed countries: UN classificationLebanonLesothoLiberiaLibyaLithuaniaLow & middle incomeLow incomeLower middle incomeLuxembourgMacao SAR, ChinaMacedonia, FYRMadagascarMalawiMalaysiaMaldivesMaliMaltaMauritaniaMauritiusMexicoMiddle East & North AfricaMiddle East & North Africa (excluding high income)Middle East & North Africa (IDA & IBRD countries)Middle incomeMoldovaMongoliaMontenegroMoroccoMozambiqueNamibiaNepalNetherlandsNew ZealandNicaraguaNigerNigeriaNorth AmericaNorwayOECD membersOmanOther small statesPacific island small statesPakistanPanamaPapua New GuineaParaguayPeruPhilippinesPolandPortugalPost-demographic dividendPre-demographic dividendQatarRomaniaRussian FederationRwandaSaudi ArabiaSenegalSerbiaSeychellesSierra LeoneSingaporeSlovak RepublicSloveniaSmall statesSolomon IslandsSouth AfricaSouth AsiaSouth Asia (IDA & IBRD)SpainSri LankaSt. Kitts and NevisSt. LuciaSt. Vincent and the GrenadinesSub-Saharan Africa Sub-Saharan Africa (excluding high income)Sub-Saharan Africa (IDA & IBRD countries)SudanSurinameSwazilandSwedenSwitzerlandSyrian Arab RepublicTajikistanTanzaniaThailandTimor-LesteTogoTongaTrinidad and TobagoTunisiaTurkeyTurkmenistanUgandaUkraineUnited KingdomUnited StatesUpper middle incomeUruguayVanuatuVenezuela, RBVietnamWest Bank and GazaWorldYemen, Rep.ZambiaZimbabwe La ligne de temps
Cette échelle de temps montre un graphique de 1977 année à 2014 année Greece. Les données jusqu'à 1976 année ne sont pas présentés. Quantité d'observations actuelles selon dates: 37.
Source (désignation):
Les indicateurs du développement mondiale
Source (organisation):
World Bank national accounts data files.
Catégories:
Economy & Growth, Environment
Dernière mise à jour
23 avr. 2017
Les indicateurs de changement de valeurs selon les années
Minimum:
5.367
1 janv. 2012
Maximum:
35.705
1 janv. 1977
Pour la date d''observation
Valeur
Changement absolu
Le changement par rapport à la valeur précédente
1 janv. 1977
35.705
+35.705
0.0%
1 janv. 1978
31.449
-4.256
-11.92%
1 janv. 1979
30.711
-0.737
-2.34%
1 janv. 1980
30.698
-0.014
-0.04%
1 janv. 1981
28.571
-2.127
-6.93%
1 janv. 1982
24.764
-3.806
-13.32%
1 janv. 1983
27.108
+2.343
9.46%
1 janv. 1984
25.556
-1.552
-5.72%
1 janv. 1985
26.666
+1.11
4.34%
1 janv. 1986
27.255
+0.589
2.21%
1 janv. 1987
27.394
+0.139
0.51%
1 janv. 1988
22.231
-5.164
-18.85%
1 janv. 1989
24.796
+2.566
11.54%
1 janv. 1990
23.537
-1.259
-5.08%
1 janv. 1991
23.349
-0.188
-0.8%
1 janv. 1992
25.898
+2.548
10.91%
1 janv. 1993
24.009
-1.889
-7.29%
1 janv. 1994
23.086
-0.923
-3.84%
1 janv. 1995
23.349
+0.263
1.14%
1 janv. 1996
22.002
-1.347
-5.77%
1 janv. 1997
21.015
-0.987
-4.49%
1 janv. 1998
21.478
+0.464
2.21%
1 janv. 2000
17.079
-4.399
-20.48%
1 janv. 2001
17.758
+0.68
3.98%
1 janv. 2002
18.26
+0.501
2.82%
1 janv. 2003
16.759
-1.501
-8.22%
1 janv. 2004
18.029
+1.27
7.58%
1 janv. 2005
17.606
-0.423
-2.35%
1 janv. 2006
15.396
-2.209
-12.55%
1 janv. 2007
15.52
+0.124
0.8%
1 janv. 2008
13.029
-2.49
-16.05%
1 janv. 2009
10.282
-2.747
-21.08%
1 janv. 2010
5.908
-4.374
-42.54%
1 janv. 2011
5.766
-0.142
-2.4%
1 janv. 2012
5.367
-0.399
-6.93%
1 janv. 2013
9.847
+4.48
83.48%
1 janv. 2014
10.663
+0.815
8.28%
Classement des pays selon les statistiques actuelles par années


Commentaires: