29
/fr/
fr
AIzaSyAYiBZKx7MnpbEhh9jyipgxe19OcubqV5w
April 1, 2024
113195
Cote d'Ivoire
CIV
true
2
1
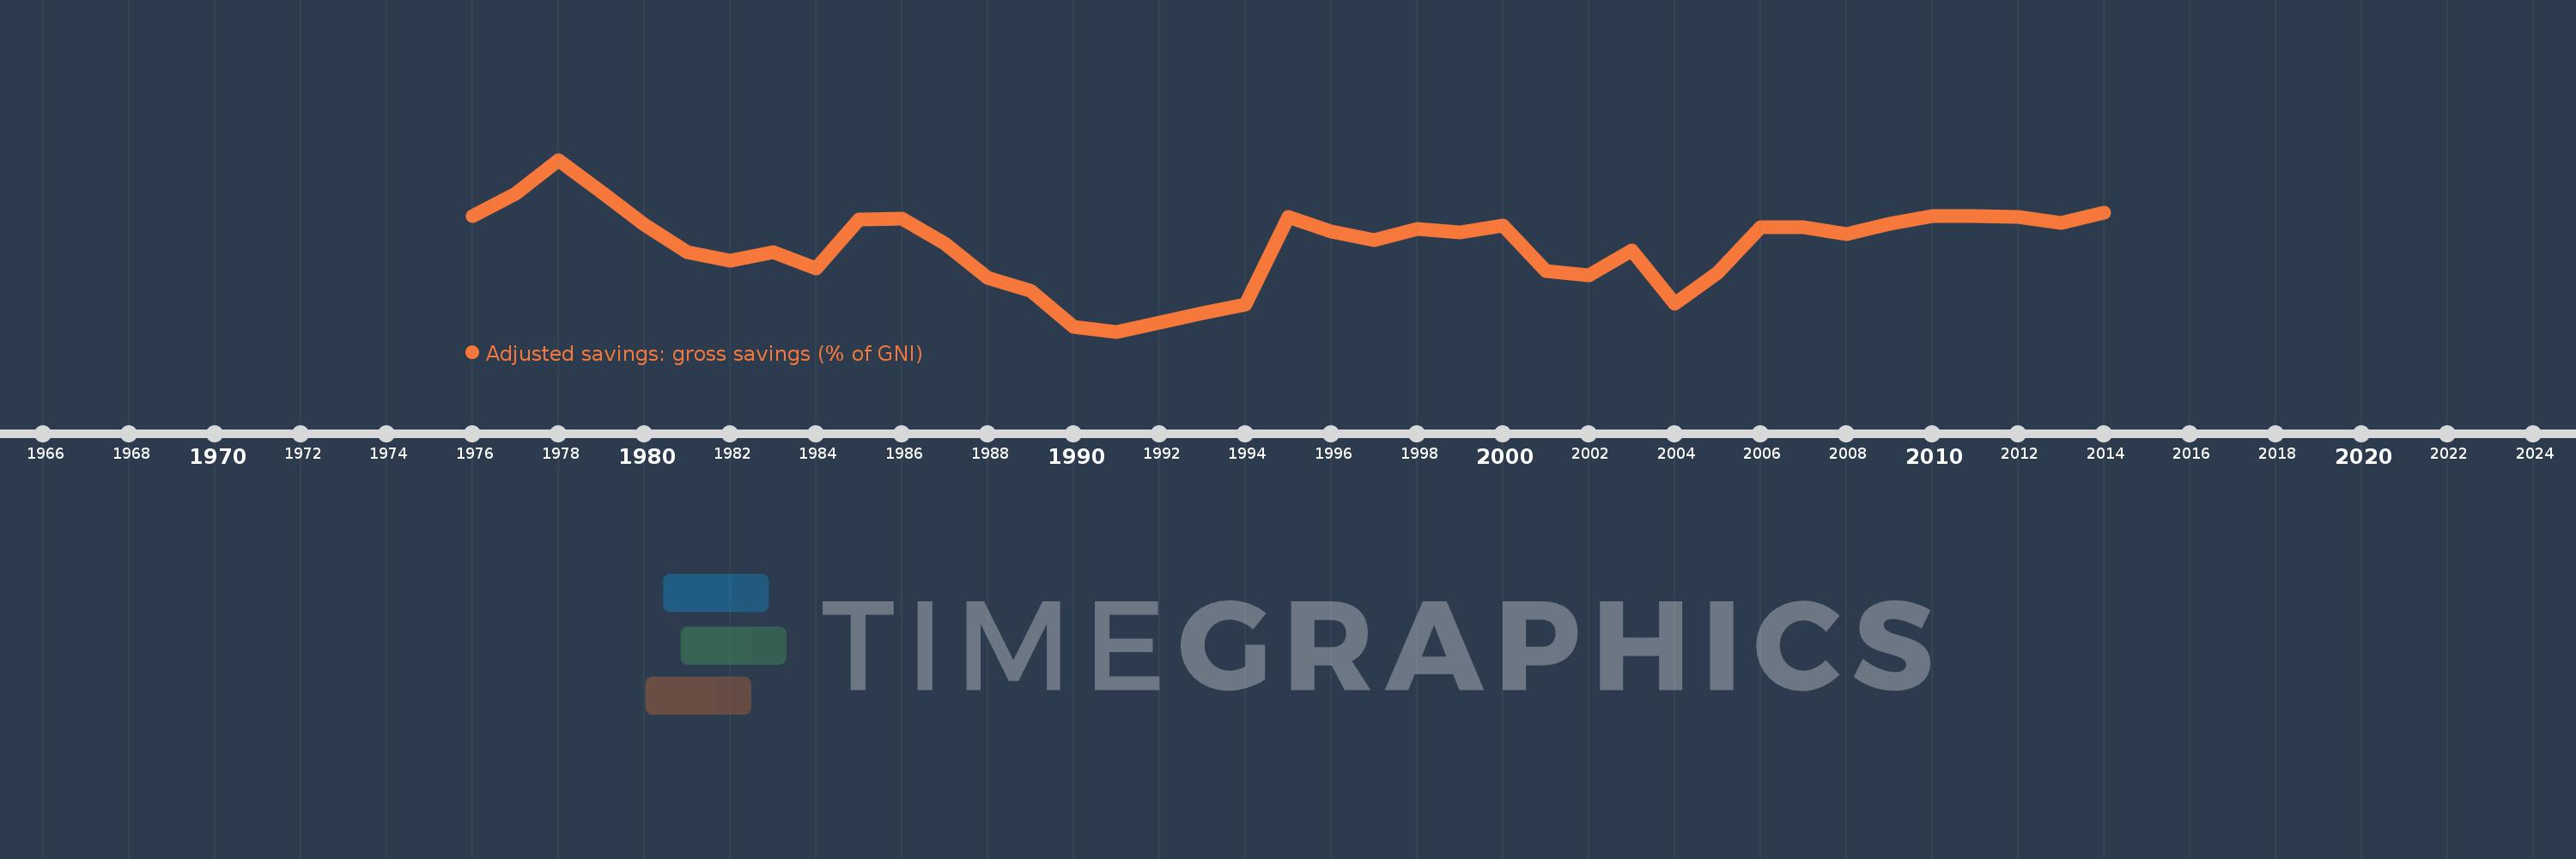
Adjusted savings: gross savings (% of GNI)
2014,2013,2012,2011,2010,2009,2008,2007,2006,2005,2004,2003,2002,2001,2000,1999,1998,1997,1996,1995,1994,1993,1992,1991,1990,1989,1988,1987,1986,1985,1984,1983,1982,1981,1980,1979,1978,1977,1976
Cette statistique dans les autres pays:
AfghanistanAlbaniaAlgeriaAngolaAntigua and BarbudaArab WorldArgentinaArmeniaAustraliaAustriaAzerbaijanBahamas, TheBahrainBangladeshBarbadosBelarusBelgiumBelizeBeninBermudaBhutanBoliviaBosnia and HerzegovinaBotswanaBrazilBrunei DarussalamBulgariaBurkina FasoBurundiCabo VerdeCambodiaCameroonCanadaCaribbean small statesCentral African RepublicCentral Europe and the BalticsChadChileChinaColombiaComorosCongo, Dem. Rep.Congo, Rep.Costa RicaCote d'IvoireCroatiaCyprusCzech RepublicDenmarkDjiboutiDominicaDominican RepublicEarly-demographic dividendEast Asia & PacificEast Asia & Pacific (excluding high income)East Asia & Pacific (IDA & IBRD countries)EcuadorEgypt, Arab Rep.El SalvadorEquatorial GuineaEritreaEstoniaEthiopiaEuro areaEurope & Central AsiaEurope & Central Asia (excluding high income)Europe & Central Asia (IDA & IBRD countries)European UnionFaroe IslandsFijiFinlandFragile and conflict affected situationsFranceGabonGambia, TheGeorgiaGermanyGhanaGreeceGrenadaGuatemalaGuineaGuinea-BissauGuyanaHaitiHeavily indebted poor countries (HIPC)High incomeHondurasHong Kong SAR, ChinaHungaryIBRD onlyIcelandIDA & IBRD totalIDA blendIDA onlyIDA totalIndiaIndonesiaIran, Islamic Rep.IraqIrelandIsraelItalyJamaicaJapanJordanKazakhstanKenyaKiribatiKorea, Rep.KosovoKuwaitKyrgyz RepublicLao PDRLate-demographic dividendLatin America & Caribbean Latin America & Caribbean (excluding high income)Latin America & the Caribbean (IDA & IBRD countries)LatviaLeast developed countries: UN classificationLebanonLesothoLiberiaLibyaLithuaniaLow & middle incomeLow incomeLower middle incomeLuxembourgMacao SAR, ChinaMacedonia, FYRMadagascarMalawiMalaysiaMaldivesMaliMaltaMauritaniaMauritiusMexicoMiddle East & North AfricaMiddle East & North Africa (excluding high income)Middle East & North Africa (IDA & IBRD countries)Middle incomeMoldovaMongoliaMontenegroMoroccoMozambiqueNamibiaNepalNetherlandsNew ZealandNicaraguaNigerNigeriaNorth AmericaNorwayOECD membersOmanOther small statesPacific island small statesPakistanPanamaPapua New GuineaParaguayPeruPhilippinesPolandPortugalPost-demographic dividendPre-demographic dividendQatarRomaniaRussian FederationRwandaSaudi ArabiaSenegalSerbiaSeychellesSierra LeoneSingaporeSlovak RepublicSloveniaSmall statesSolomon IslandsSouth AfricaSouth AsiaSouth Asia (IDA & IBRD)SpainSri LankaSt. Kitts and NevisSt. LuciaSt. Vincent and the GrenadinesSub-Saharan Africa Sub-Saharan Africa (excluding high income)Sub-Saharan Africa (IDA & IBRD countries)SudanSurinameSwazilandSwedenSwitzerlandSyrian Arab RepublicTajikistanTanzaniaThailandTimor-LesteTogoTongaTrinidad and TobagoTunisiaTurkeyTurkmenistanUgandaUkraineUnited KingdomUnited StatesUpper middle incomeUruguayVanuatuVenezuela, RBVietnamWest Bank and GazaWorldYemen, Rep.ZambiaZimbabwe La ligne de temps
Cette échelle de temps montre un graphique de 1976 année à 2014 année Cote d'Ivoire. Les données jusqu'à 1975 année ne sont pas présentés. Quantité d'observations actuelles selon dates: 39.
Source (désignation):
Les indicateurs du développement mondiale
Source (organisation):
World Bank national accounts data files.
Catégories:
Economy & Growth, Environment
Dernière mise à jour
23 avr. 2017
Les indicateurs de changement de valeurs selon les années
Minimum:
-5.987
1 janv. 1991
Maximum:
26.57
1 janv. 1978
Pour la date d''observation
Valeur
Changement absolu
Le changement par rapport à la valeur précédente
1 janv. 1976
15.902
+15.902
0.0%
1 janv. 1977
20.219
+4.317
27.15%
1 janv. 1978
26.57
+6.351
31.41%
1 janv. 1979
20.449
-6.121
-23.04%
1 janv. 1980
14.341
-6.108
-29.87%
1 janv. 1981
8.996
-5.345
-37.27%
1 janv. 1982
7.415
-1.581
-17.58%
1 janv. 1983
9.008
+1.593
21.49%
1 janv. 1984
5.897
-3.111
-34.53%
1 janv. 1985
15.232
+9.335
158.3%
1 janv. 1986
15.44
+0.208
1.37%
1 janv. 1987
10.762
-4.677
-30.29%
1 janv. 1988
4.107
-6.655
-61.84%
1 janv. 1989
1.696
-2.411
-58.7%
1 janv. 1990
-5.101
-6.797
-400.75%
1 janv. 1991
-5.987
-0.886
17.36%
1 janv. 1992
-4.253
+1.734
-28.96%
1 janv. 1993
-2.539
+1.714
-40.31%
1 janv. 1994
-0.915
+1.623
-63.94%
1 janv. 1995
15.69
+16.606
-1.81 milles%
1 janv. 1996
12.949
-2.741
-17.47%
1 janv. 1997
11.279
-1.67
-12.9%
1 janv. 1998
13.494
+2.214
19.63%
1 janv. 1999
12.734
-0.76
-5.63%
1 janv. 2000
14.052
+1.318
10.35%
1 janv. 2001
5.494
-8.559
-60.91%
1 janv. 2002
4.687
-0.807
-14.68%
1 janv. 2003
9.379
+4.692
100.11%
1 janv. 2004
-0.635
-10.014
-106.77%
1 janv. 2005
5.239
+5.874
-925.26%
1 janv. 2006
13.817
+8.579
163.75%
1 janv. 2007
13.837
+0.02
0.15%
1 janv. 2008
12.521
-1.316
-9.51%
1 janv. 2009
14.485
+1.963
15.68%
1 janv. 2010
15.985
+1.501
10.36%
1 janv. 2011
15.894
-0.091
-0.57%
1 janv. 2012
15.81
-0.084
-0.53%
1 janv. 2013
14.614
-1.196
-7.57%
1 janv. 2014
16.585
+1.971
13.49%
Classement des pays selon les statistiques actuelles par années


Commentaires: