29
/es/
es
AIzaSyAYiBZKx7MnpbEhh9jyipgxe19OcubqV5w
April 1, 2024
98868
Cambodia
KHM
true
2
1
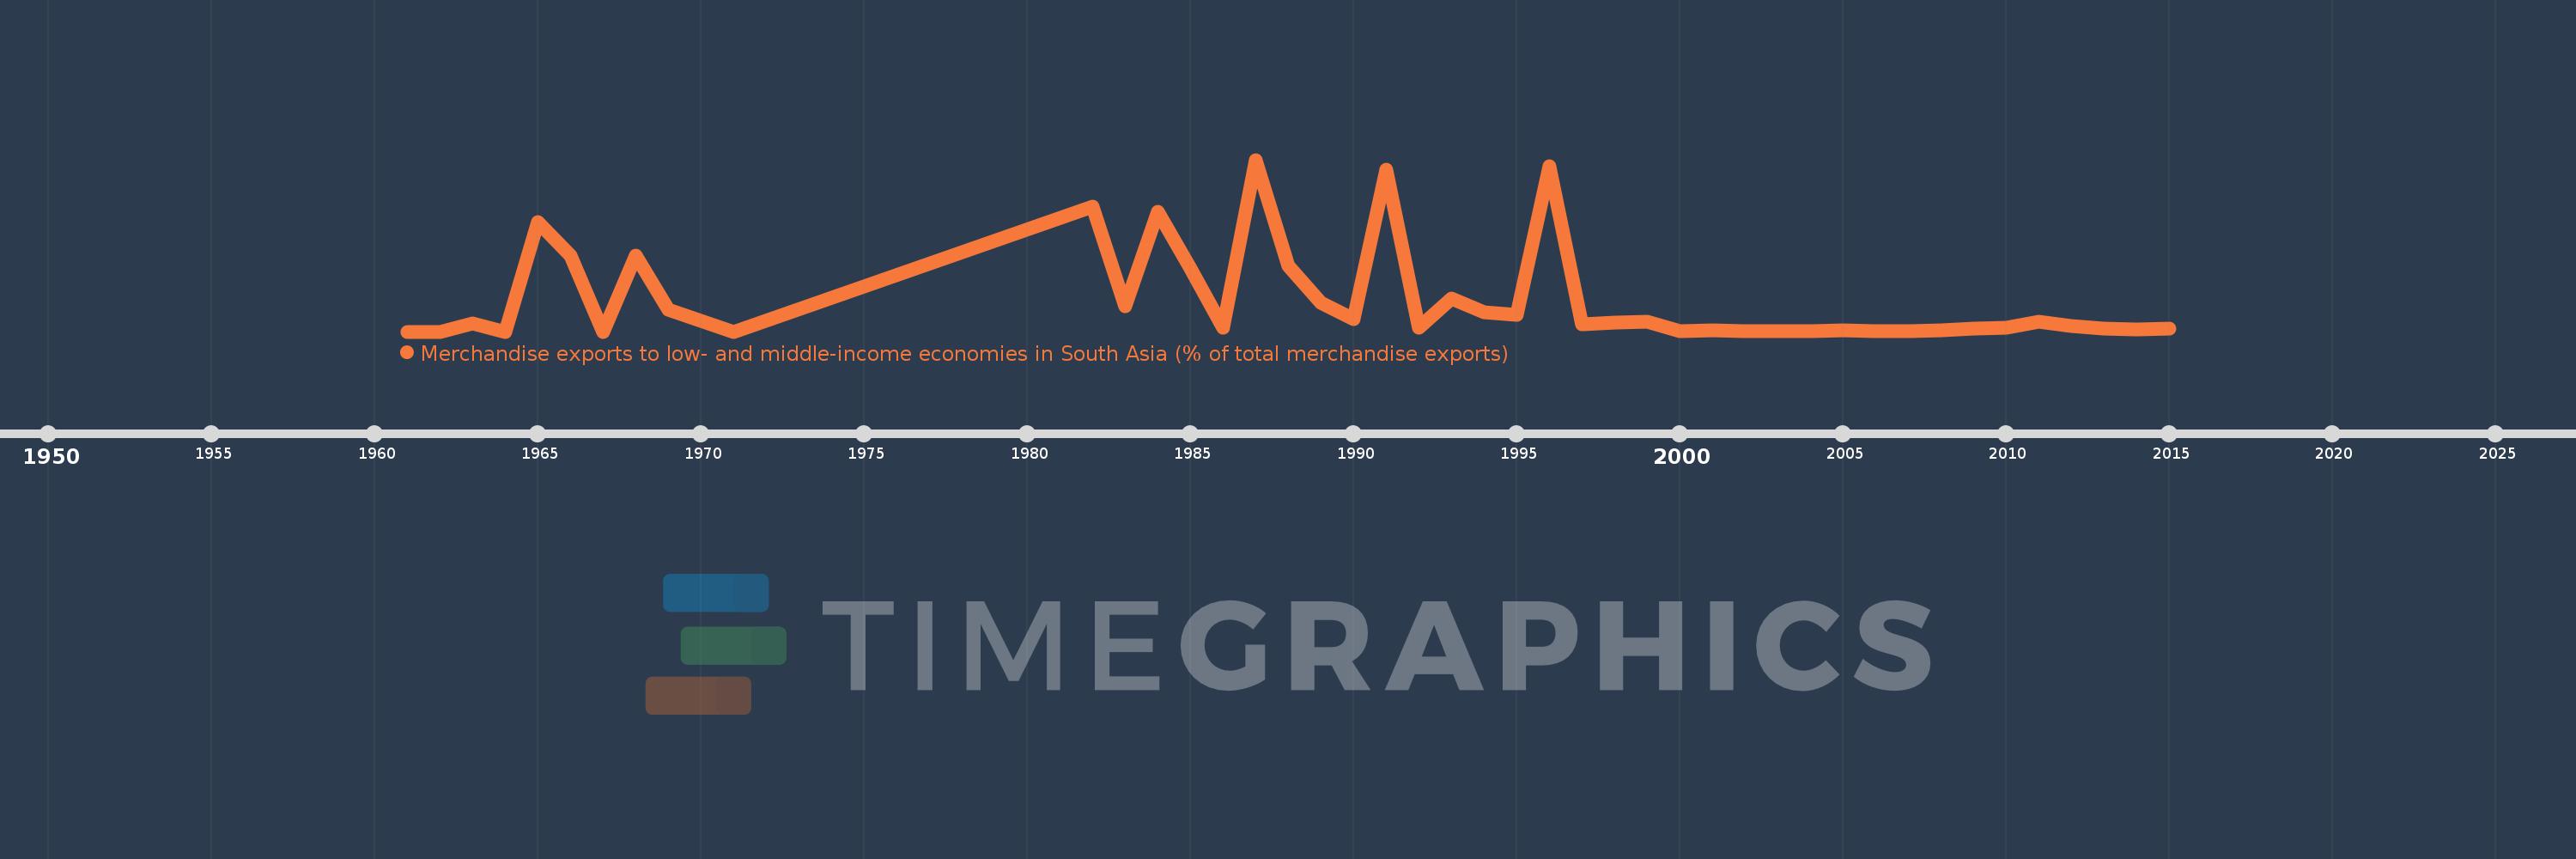
Merchandise exports to low- and middle-income economies in South Asia (% of total merchandise exports)
2015,2014,2013,2012,2011,2010,2009,2008,2007,2006,2005,2004,2003,2002,2001,2000,1999,1998,1997,1996,1995,1994,1993,1992,1991,1990,1989,1988,1987,1986,1985,1984,1983,1982,1971,1969,1968,1967,1966,1965,1964,1963,1962,1961
Estas estadísticas en otros países:
AfghanistanAlbaniaAlgeriaAngolaAntigua and BarbudaArab WorldArgentinaArmeniaArubaAustraliaAustriaAzerbaijanBahamas, TheBahrainBangladeshBarbadosBelarusBelgiumBelizeBeninBermudaBoliviaBrazilBrunei DarussalamBulgariaBurkina FasoBurundiCabo VerdeCambodiaCameroonCanadaCaribbean small statesCentral African RepublicCentral Europe and the BalticsChadChileChinaColombiaCongo, Rep.Costa RicaCote d'IvoireCroatiaCyprusCzech RepublicDenmarkDjiboutiDominicaDominican RepublicEarly-demographic dividendEast Asia & PacificEast Asia & Pacific (excluding high income)East Asia & Pacific (IDA & IBRD countries)EcuadorEgypt, Arab Rep.El SalvadorEstoniaEthiopiaEuro areaEurope & Central AsiaEurope & Central Asia (excluding high income)Europe & Central Asia (IDA & IBRD countries)European UnionFaroe IslandsFijiFinlandFragile and conflict affected situationsFranceGabonGambia, TheGeorgiaGermanyGhanaGibraltarGreeceGreenlandGrenadaGuatemalaGuineaGuyanaHaitiHeavily indebted poor countries (HIPC)High incomeHondurasHong Kong SAR, ChinaHungaryIBRD onlyIcelandIDA & IBRD totalIDA blendIDA onlyIDA totalIndiaIndonesiaIran, Islamic Rep.IraqIrelandIsraelItalyJamaicaJapanJordanKazakhstanKenyaKiribatiKorea, Dem. People’s Rep.Korea, Rep.KosovoKuwaitKyrgyz RepublicLao PDRLate-demographic dividendLatin America & Caribbean Latin America & Caribbean (excluding high income)Latin America & the Caribbean (IDA & IBRD countries)LatviaLeast developed countries: UN classificationLebanonLiberiaLibyaLithuaniaLow & middle incomeLow incomeLower middle incomeLuxembourgMacao SAR, ChinaMacedonia, FYRMadagascarMalawiMalaysiaMaldivesMaliMaltaMauritaniaMauritiusMexicoMiddle East & North AfricaMiddle East & North Africa (excluding high income)Middle East & North Africa (IDA & IBRD countries)Middle incomeMoldovaMongoliaMontenegroMoroccoMozambiqueMyanmarNauruNepalNetherlandsNew CaledoniaNew ZealandNicaraguaNigerNigeriaNorth AmericaNorwayOECD membersOmanOther small statesPacific island small statesPakistanPanamaPapua New GuineaParaguayPeruPhilippinesPolandPortugalPost-demographic dividendPre-demographic dividendQatarRomaniaRussian FederationRwandaSamoaSaudi ArabiaSenegalSerbiaSeychellesSierra LeoneSingaporeSlovak RepublicSloveniaSmall statesSomaliaSouth AfricaSouth AsiaSouth Asia (IDA & IBRD)SpainSri LankaSt. LuciaSt. Vincent and the GrenadinesSub-Saharan Africa Sub-Saharan Africa (excluding high income)Sub-Saharan Africa (IDA & IBRD countries)SudanSurinameSwedenSwitzerlandSyrian Arab RepublicTajikistanTanzaniaThailandTogoTongaTrinidad and TobagoTunisiaTurkeyTurkmenistanUgandaUkraineUnited Arab EmiratesUnited KingdomUnited StatesUpper middle incomeUruguayVanuatuVenezuela, RBVietnamWorldYemen, Rep.ZambiaZimbabwe línea de tiempo (timeline):
En esta escala de tiempo se presenta un gráfico de 1961 y 2015 de Cambodia. Los datos de 1960 están ausentes. El número de observaciones reales por fecha: 44.
Fuente (nombre):
Indicadores del desarrollo mundial
Fuente (organización):
World Bank staff estimates based data from International Monetary Fund's Direction of Trade database.
Categorías:
Private Sector, Trade
Se ha actualizado:
23 abr 2017 año
Los indicadores de los cambios de valor en los últimos años
Máximo:
8.024
1 ene 1987 año
A la fecha de observación
Valor
Cambio absoluto
El cambio con respecto al valor anterior
1 ene 1961 año
0.0
0.0
0.0%
1 ene 1963 año
0.368
+0.368
%
1 ene 1964 año
0.0
-0.368
-100.0%
1 ene 1965 año
5.114
+5.114
%
1 ene 1966 año
3.563
-1.551
-30.33%
1 ene 1967 año
0.0
-3.563
-100.0%
1 ene 1968 año
3.532
+3.532
%
1 ene 1969 año
1.026
-2.506
-70.95%
1 ene 1971 año
0.0
-1.026
-100.0%
1 ene 1982 año
5.824
+5.824
%
1 ene 1983 año
1.17
-4.653
-79.9%
1 ene 1984 año
5.605
+4.434
378.88%
1 ene 1985 año
2.937
-2.667
-47.59%
1 ene 1986 año
0.189
-2.748
-93.57%
1 ene 1987 año
8.024
+7.836
4.15 mil%
1 ene 1988 año
3.065
-4.959
-61.8%
1 ene 1989 año
1.361
-1.704
-55.6%
1 ene 1990 año
0.566
-0.795
-58.41%
1 ene 1991 año
7.573
+7.007
1.24 mil%
1 ene 1992 año
0.196
-7.377
-97.42%
1 ene 1993 año
1.558
+1.363
696.41%
1 ene 1994 año
0.922
-0.637
-40.85%
1 ene 1995 año
0.801
-0.121
-13.11%
1 ene 1996 año
7.742
+6.941
866.77%
1 ene 1997 año
0.322
-7.419
-95.84%
1 ene 1998 año
0.422
+0.1
30.91%
1 ene 1999 año
0.464
+0.042
9.96%
1 ene 2000 año
0.017
-0.447
-96.27%
1 ene 2001 año
0.073
+0.055
319.62%
1 ene 2002 año
0.036
-0.037
-50.27%
1 ene 2003 año
0.018
-0.018
-49.59%
1 ene 2004 año
0.013
-0.005
-29.11%
1 ene 2005 año
0.049
+0.036
279.92%
1 ene 2006 año
0.038
-0.011
-23.44%
1 ene 2007 año
0.033
-0.005
-12.98%
1 ene 2008 año
0.048
+0.015
45.67%
1 ene 2009 año
0.136
+0.088
185.28%
1 ene 2010 año
0.163
+0.027
20.02%
1 ene 2011 año
0.458
+0.295
181.35%
1 ene 2012 año
0.278
-0.181
-39.43%
1 ene 2013 año
0.142
-0.136
-48.8%
1 ene 2014 año
0.114
-0.028
-19.62%
1 ene 2015 año
0.16
+0.046
40.41%
Ranking de los países por los datos estadísticos actuales


Comentarios: