29
/es/
es
AIzaSyAYiBZKx7MnpbEhh9jyipgxe19OcubqV5w
April 1, 2024
117147
Cyprus
CYP
true
2
1
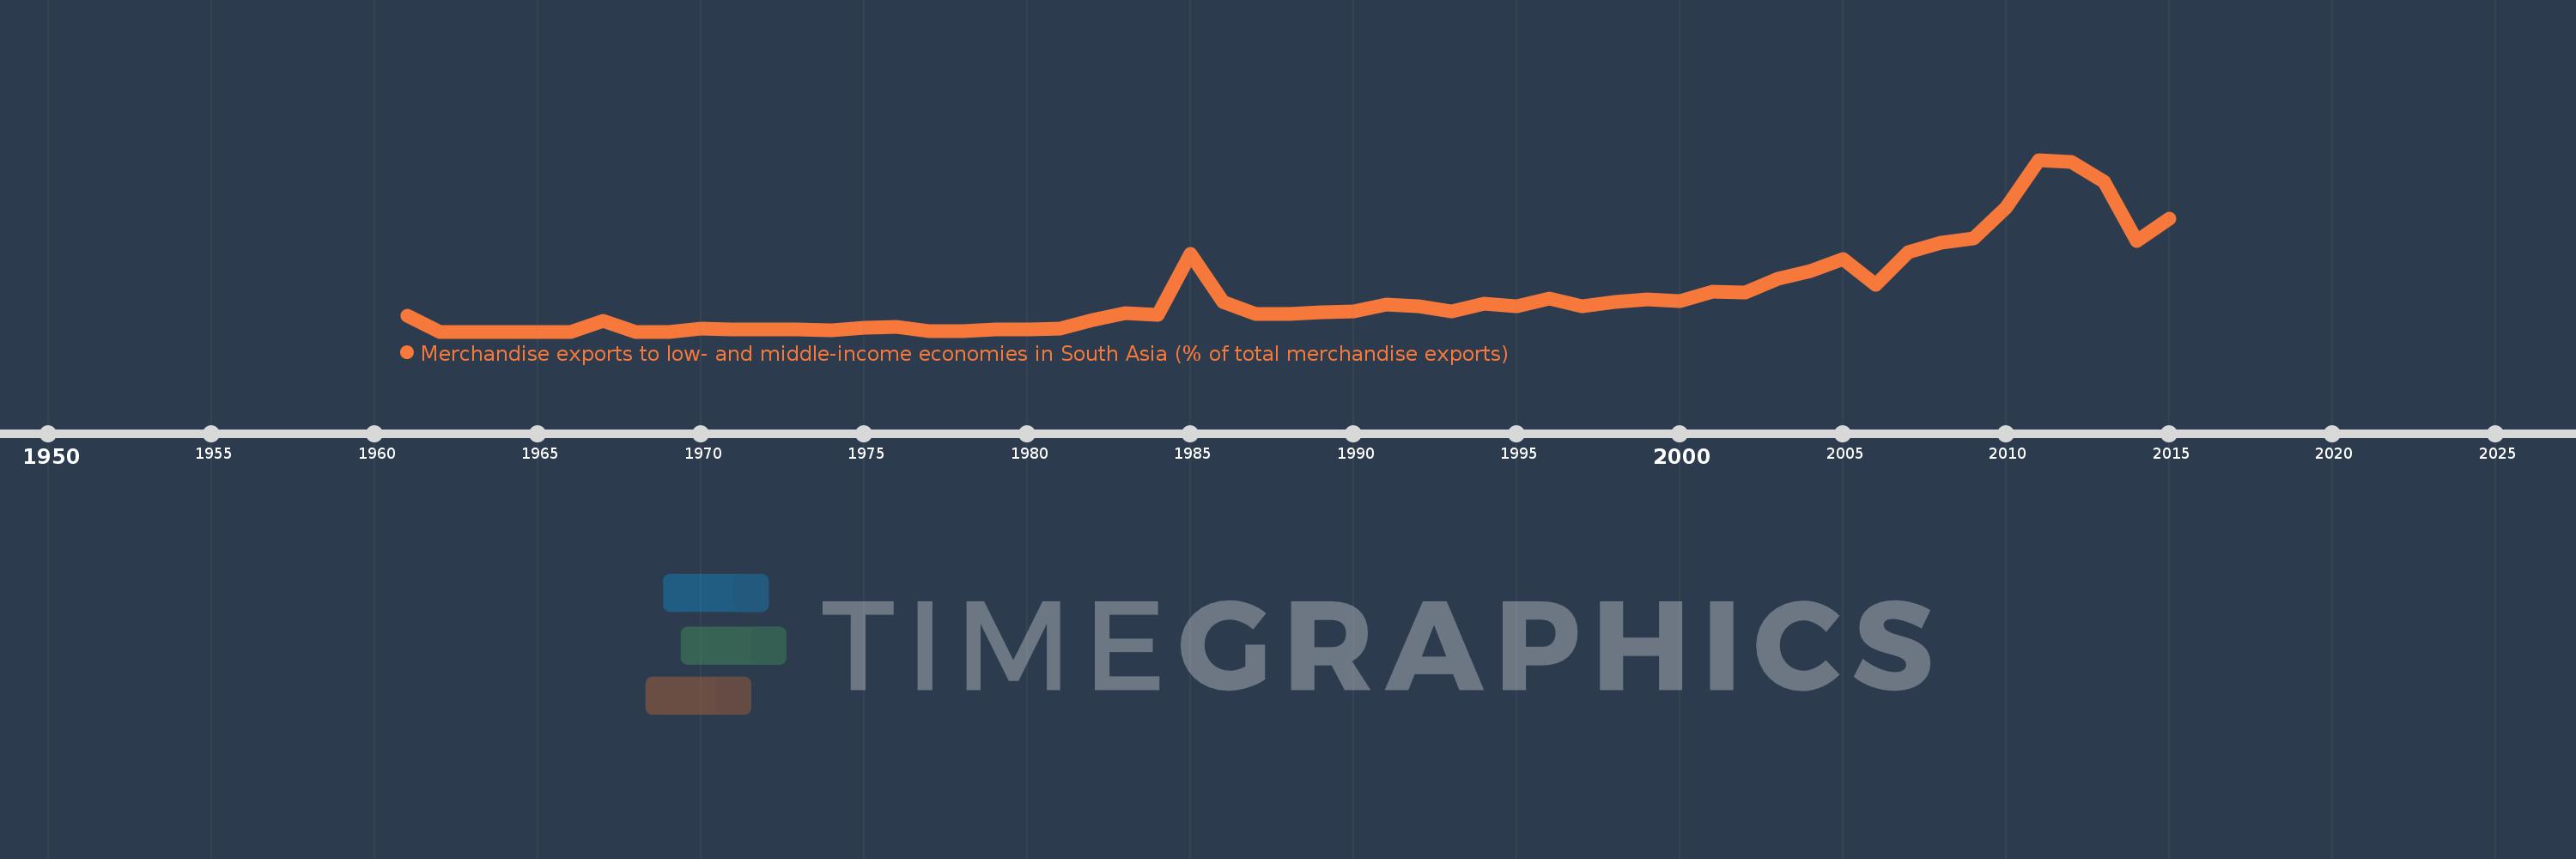
Merchandise exports to low- and middle-income economies in South Asia (% of total merchandise exports)
2015,2014,2013,2012,2011,2010,2009,2008,2007,2006,2005,2004,2003,2002,2001,2000,1999,1998,1997,1996,1995,1994,1993,1992,1991,1990,1989,1988,1987,1986,1985,1984,1983,1982,1981,1980,1979,1978,1977,1976,1975,1974,1973,1972,1971,1970,1969,1968,1967,1966,1965,1964,1963,1962,1961
Estas estadísticas en otros países:
AfghanistanAlbaniaAlgeriaAngolaAntigua and BarbudaArab WorldArgentinaArmeniaArubaAustraliaAustriaAzerbaijanBahamas, TheBahrainBangladeshBarbadosBelarusBelgiumBelizeBeninBermudaBoliviaBrazilBrunei DarussalamBulgariaBurkina FasoBurundiCabo VerdeCambodiaCameroonCanadaCaribbean small statesCentral African RepublicCentral Europe and the BalticsChadChileChinaColombiaCongo, Rep.Costa RicaCote d'IvoireCroatiaCyprusCzech RepublicDenmarkDjiboutiDominicaDominican RepublicEarly-demographic dividendEast Asia & PacificEast Asia & Pacific (excluding high income)East Asia & Pacific (IDA & IBRD countries)EcuadorEgypt, Arab Rep.El SalvadorEstoniaEthiopiaEuro areaEurope & Central AsiaEurope & Central Asia (excluding high income)Europe & Central Asia (IDA & IBRD countries)European UnionFaroe IslandsFijiFinlandFragile and conflict affected situationsFranceGabonGambia, TheGeorgiaGermanyGhanaGibraltarGreeceGreenlandGrenadaGuatemalaGuineaGuyanaHaitiHeavily indebted poor countries (HIPC)High incomeHondurasHong Kong SAR, ChinaHungaryIBRD onlyIcelandIDA & IBRD totalIDA blendIDA onlyIDA totalIndiaIndonesiaIran, Islamic Rep.IraqIrelandIsraelItalyJamaicaJapanJordanKazakhstanKenyaKiribatiKorea, Dem. People’s Rep.Korea, Rep.KosovoKuwaitKyrgyz RepublicLao PDRLate-demographic dividendLatin America & Caribbean Latin America & Caribbean (excluding high income)Latin America & the Caribbean (IDA & IBRD countries)LatviaLeast developed countries: UN classificationLebanonLiberiaLibyaLithuaniaLow & middle incomeLow incomeLower middle incomeLuxembourgMacao SAR, ChinaMacedonia, FYRMadagascarMalawiMalaysiaMaldivesMaliMaltaMauritaniaMauritiusMexicoMiddle East & North AfricaMiddle East & North Africa (excluding high income)Middle East & North Africa (IDA & IBRD countries)Middle incomeMoldovaMongoliaMontenegroMoroccoMozambiqueMyanmarNauruNepalNetherlandsNew CaledoniaNew ZealandNicaraguaNigerNigeriaNorth AmericaNorwayOECD membersOmanOther small statesPacific island small statesPakistanPanamaPapua New GuineaParaguayPeruPhilippinesPolandPortugalPost-demographic dividendPre-demographic dividendQatarRomaniaRussian FederationRwandaSamoaSaudi ArabiaSenegalSerbiaSeychellesSierra LeoneSingaporeSlovak RepublicSloveniaSmall statesSomaliaSouth AfricaSouth AsiaSouth Asia (IDA & IBRD)SpainSri LankaSt. LuciaSt. Vincent and the GrenadinesSub-Saharan Africa Sub-Saharan Africa (excluding high income)Sub-Saharan Africa (IDA & IBRD countries)SudanSurinameSwedenSwitzerlandSyrian Arab RepublicTajikistanTanzaniaThailandTogoTongaTrinidad and TobagoTunisiaTurkeyTurkmenistanUgandaUkraineUnited Arab EmiratesUnited KingdomUnited StatesUpper middle incomeUruguayVanuatuVenezuela, RBVietnamWorldYemen, Rep.ZambiaZimbabwe línea de tiempo (timeline):
En esta escala de tiempo se presenta un gráfico de 1961 y 2015 de Cyprus. Los datos de 1960 están ausentes. El número de observaciones reales por fecha: 55.
Fuente (nombre):
Indicadores del desarrollo mundial
Fuente (organización):
World Bank staff estimates based data from International Monetary Fund's Direction of Trade database.
Categorías:
Private Sector, Trade
Se ha actualizado:
23 abr 2017 año
Los indicadores de los cambios de valor en los últimos años
Máximo:
1.979
1 ene 2011 año
A la fecha de observación
Valor
Cambio absoluto
El cambio con respecto al valor anterior
1 ene 1961 año
0.187
+0.187
0.0%
1 ene 1962 año
0.0
-0.187
-100.0%
1 ene 1967 año
0.128
+0.128
%
1 ene 1968 año
0.0
-0.128
-100.0%
1 ene 1970 año
0.039
+0.039
%
1 ene 1971 año
0.027
-0.012
-30.71%
1 ene 1972 año
0.029
+0.001
5.01%
1 ene 1973 año
0.025
-0.004
-13.61%
1 ene 1974 año
0.013
-0.011
-45.76%
1 ene 1975 año
0.047
+0.034
253.96%
1 ene 1976 año
0.057
+0.01
20.81%
1 ene 1977 año
0.008
-0.049
-85.5%
1 ene 1978 año
0.008
0.0
-5.03%
1 ene 1979 año
0.023
+0.015
194.54%
1 ene 1980 año
0.022
-0.002
-6.71%
1 ene 1981 año
0.032
+0.01
47.13%
1 ene 1982 año
0.132
+0.1
313.87%
1 ene 1983 año
0.208
+0.077
58.16%
1 ene 1984 año
0.19
-0.018
-8.67%
1 ene 1985 año
0.896
+0.706
370.84%
1 ene 1986 año
0.345
-0.551
-61.46%
1 ene 1987 año
0.199
-0.146
-42.42%
1 ene 1988 año
0.2
+0.001
0.68%
1 ene 1989 año
0.224
+0.023
11.68%
1 ene 1990 año
0.228
+0.004
1.89%
1 ene 1991 año
0.308
+0.08
35.26%
1 ene 1992 año
0.294
-0.014
-4.55%
1 ene 1993 año
0.233
-0.061
-20.84%
1 ene 1994 año
0.319
+0.086
36.79%
1 ene 1995 año
0.293
-0.026
-8.11%
1 ene 1996 año
0.384
+0.091
31.1%
1 ene 1997 año
0.295
-0.089
-23.11%
1 ene 1998 año
0.337
+0.042
14.35%
1 ene 1999 año
0.376
+0.039
11.59%
1 ene 2000 año
0.353
-0.023
-6.15%
1 ene 2001 año
0.463
+0.11
31.06%
1 ene 2002 año
0.455
-0.008
-1.64%
1 ene 2003 año
0.611
+0.155
34.13%
1 ene 2004 año
0.694
+0.084
13.69%
1 ene 2005 año
0.838
+0.144
20.71%
1 ene 2006 año
0.539
-0.3
-35.73%
1 ene 2007 año
0.917
+0.379
70.27%
1 ene 2008 año
1.02
+0.102
11.16%
1 ene 2009 año
1.077
+0.057
5.57%
1 ene 2010 año
1.434
+0.357
33.16%
1 ene 2011 año
1.979
+0.545
38.05%
1 ene 2012 año
1.959
-0.02
-1.01%
1 ene 2013 año
1.729
-0.23
-11.72%
1 ene 2014 año
1.04
-0.689
-39.85%
1 ene 2015 año
1.306
+0.266
25.58%
Ranking de los países por los datos estadísticos actuales


Comentarios: