29
/es/
es
AIzaSyAYiBZKx7MnpbEhh9jyipgxe19OcubqV5w
April 1, 2024
245881
South Africa
ZAF
true
2
1
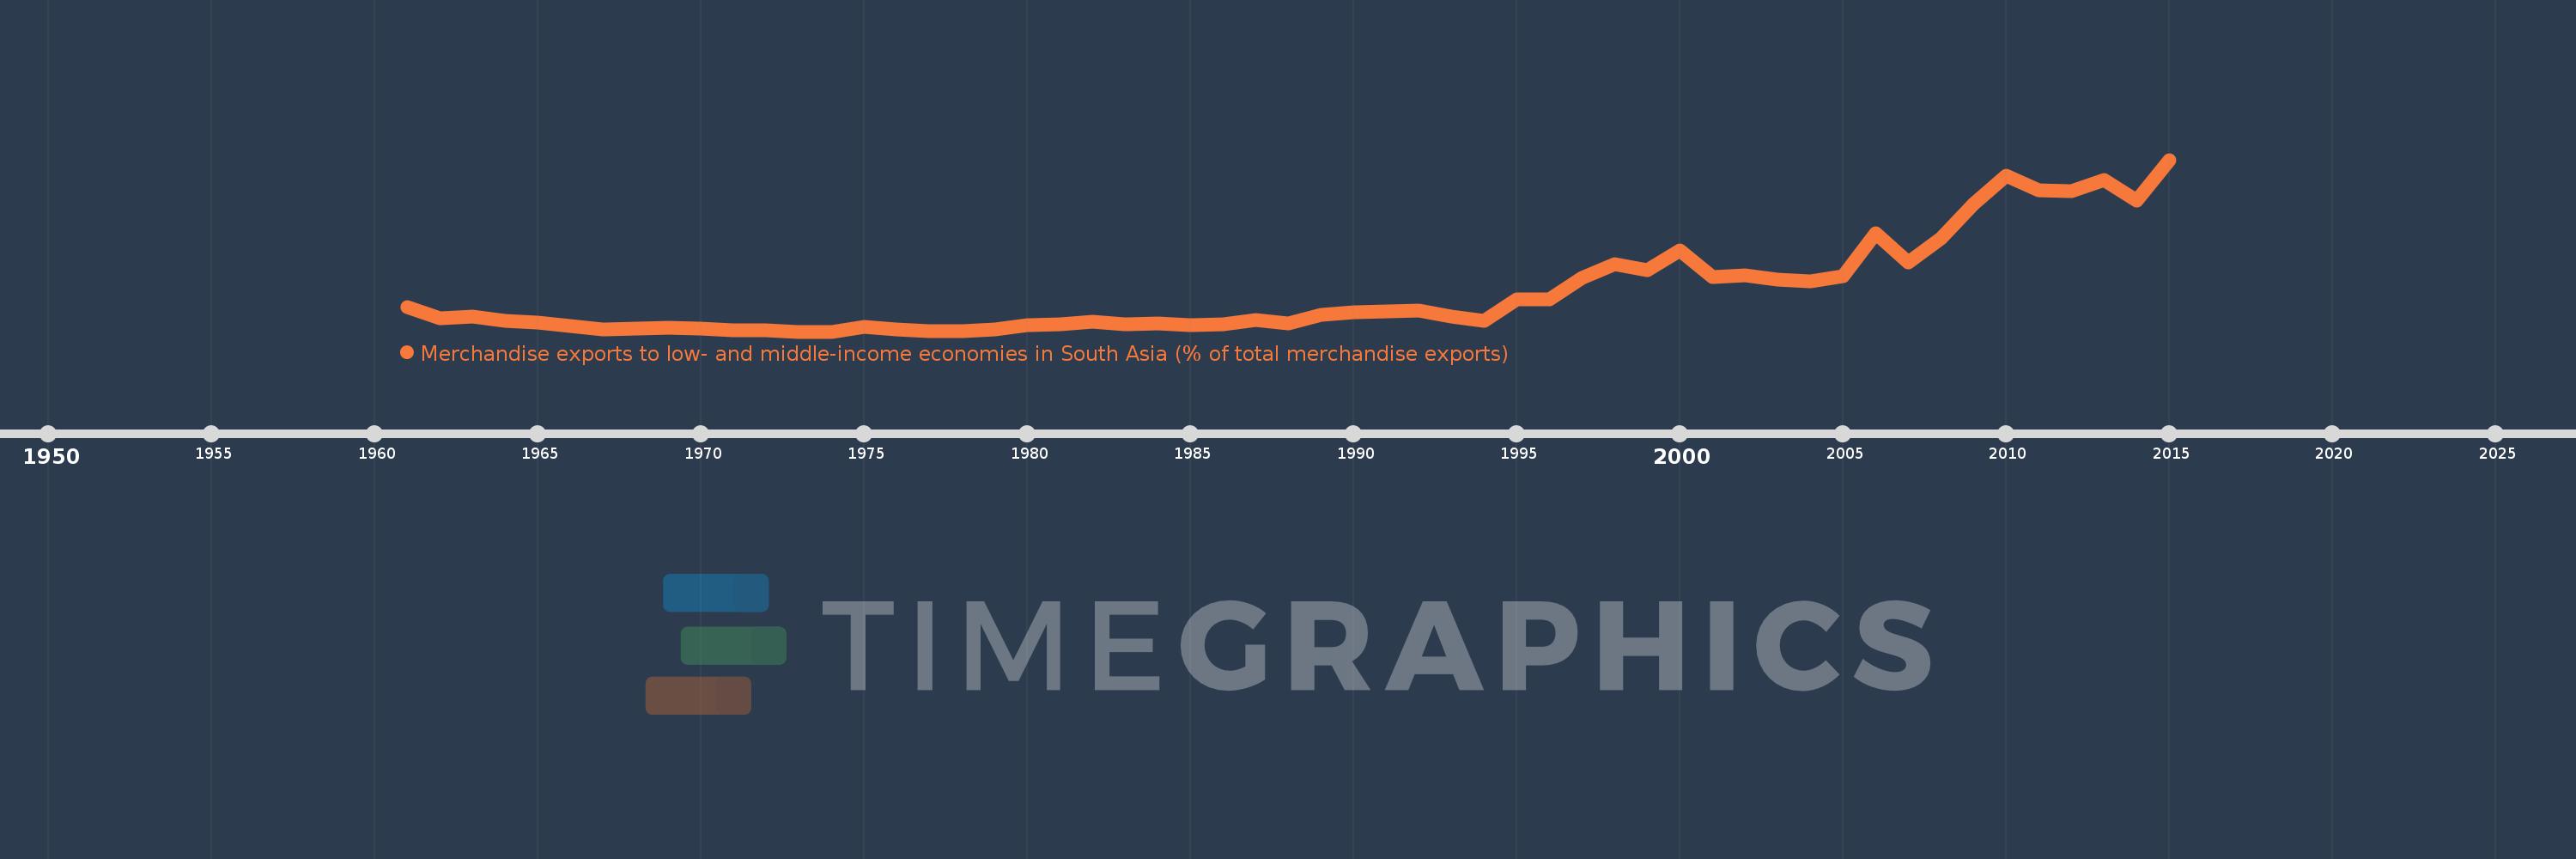
Merchandise exports to low- and middle-income economies in South Asia (% of total merchandise exports)
2015,2014,2013,2012,2011,2010,2009,2008,2007,2006,2005,2004,2003,2002,2001,2000,1999,1998,1997,1996,1995,1994,1993,1992,1991,1990,1989,1988,1987,1986,1985,1984,1983,1982,1981,1980,1979,1978,1977,1976,1975,1974,1973,1972,1971,1970,1969,1968,1967,1966,1965,1964,1963,1962,1961
Estas estadísticas en otros países:
AfghanistanAlbaniaAlgeriaAngolaAntigua and BarbudaArab WorldArgentinaArmeniaArubaAustraliaAustriaAzerbaijanBahamas, TheBahrainBangladeshBarbadosBelarusBelgiumBelizeBeninBermudaBoliviaBrazilBrunei DarussalamBulgariaBurkina FasoBurundiCabo VerdeCambodiaCameroonCanadaCaribbean small statesCentral African RepublicCentral Europe and the BalticsChadChileChinaColombiaCongo, Rep.Costa RicaCote d'IvoireCroatiaCyprusCzech RepublicDenmarkDjiboutiDominicaDominican RepublicEarly-demographic dividendEast Asia & PacificEast Asia & Pacific (excluding high income)East Asia & Pacific (IDA & IBRD countries)EcuadorEgypt, Arab Rep.El SalvadorEstoniaEthiopiaEuro areaEurope & Central AsiaEurope & Central Asia (excluding high income)Europe & Central Asia (IDA & IBRD countries)European UnionFaroe IslandsFijiFinlandFragile and conflict affected situationsFranceGabonGambia, TheGeorgiaGermanyGhanaGibraltarGreeceGreenlandGrenadaGuatemalaGuineaGuyanaHaitiHeavily indebted poor countries (HIPC)High incomeHondurasHong Kong SAR, ChinaHungaryIBRD onlyIcelandIDA & IBRD totalIDA blendIDA onlyIDA totalIndiaIndonesiaIran, Islamic Rep.IraqIrelandIsraelItalyJamaicaJapanJordanKazakhstanKenyaKiribatiKorea, Dem. People’s Rep.Korea, Rep.KosovoKuwaitKyrgyz RepublicLao PDRLate-demographic dividendLatin America & Caribbean Latin America & Caribbean (excluding high income)Latin America & the Caribbean (IDA & IBRD countries)LatviaLeast developed countries: UN classificationLebanonLiberiaLibyaLithuaniaLow & middle incomeLow incomeLower middle incomeLuxembourgMacao SAR, ChinaMacedonia, FYRMadagascarMalawiMalaysiaMaldivesMaliMaltaMauritaniaMauritiusMexicoMiddle East & North AfricaMiddle East & North Africa (excluding high income)Middle East & North Africa (IDA & IBRD countries)Middle incomeMoldovaMongoliaMontenegroMoroccoMozambiqueMyanmarNauruNepalNetherlandsNew CaledoniaNew ZealandNicaraguaNigerNigeriaNorth AmericaNorwayOECD membersOmanOther small statesPacific island small statesPakistanPanamaPapua New GuineaParaguayPeruPhilippinesPolandPortugalPost-demographic dividendPre-demographic dividendQatarRomaniaRussian FederationRwandaSamoaSaudi ArabiaSenegalSerbiaSeychellesSierra LeoneSingaporeSlovak RepublicSloveniaSmall statesSomaliaSouth AfricaSouth AsiaSouth Asia (IDA & IBRD)SpainSri LankaSt. LuciaSt. Vincent and the GrenadinesSub-Saharan Africa Sub-Saharan Africa (excluding high income)Sub-Saharan Africa (IDA & IBRD countries)SudanSurinameSwedenSwitzerlandSyrian Arab RepublicTajikistanTanzaniaThailandTogoTongaTrinidad and TobagoTunisiaTurkeyTurkmenistanUgandaUkraineUnited Arab EmiratesUnited KingdomUnited StatesUpper middle incomeUruguayVanuatuVenezuela, RBVietnamWorldYemen, Rep.ZambiaZimbabwe línea de tiempo (timeline):
En esta escala de tiempo se presenta un gráfico de 1961 y 2015 de South Africa. Los datos de 1960 están ausentes. El número de observaciones reales por fecha: 55.
Fuente (nombre):
Indicadores del desarrollo mundial
Fuente (organización):
World Bank staff estimates based data from International Monetary Fund's Direction of Trade database.
Categorías:
Private Sector, Trade
Se ha actualizado:
23 abr 2017 año
Los indicadores de los cambios de valor en los últimos años
Máximo:
4.701
1 ene 2015 año
A la fecha de observación
Valor
Cambio absoluto
El cambio con respecto al valor anterior
1 ene 1961 año
0.671
+0.671
0.0%
1 ene 1962 año
0.369
-0.302
-44.95%
1 ene 1963 año
0.421
+0.051
13.94%
1 ene 1964 año
0.296
-0.125
-29.67%
1 ene 1965 año
0.238
-0.058
-19.43%
1 ene 1966 año
0.143
-0.095
-39.92%
1 ene 1967 año
0.06
-0.084
-58.42%
1 ene 1968 año
0.071
+0.012
19.49%
1 ene 1969 año
0.104
+0.033
46.61%
1 ene 1970 año
0.08
-0.025
-23.62%
1 ene 1971 año
0.033
-0.046
-58.0%
1 ene 1972 año
0.026
-0.008
-23.15%
1 ene 1973 año
0.0
-0.026
-100.0%
1 ene 1975 año
0.135
+0.135
53.56 mil%
1 ene 1976 año
0.067
-0.068
-50.39%
1 ene 1977 año
0.01
-0.057
-85.64%
1 ene 1978 año
0.012
+0.003
27.8%
1 ene 1979 año
0.063
+0.051
414.04%
1 ene 1980 año
0.174
+0.111
176.15%
1 ene 1981 año
0.209
+0.035
20.08%
1 ene 1982 año
0.261
+0.051
24.63%
1 ene 1983 año
0.211
-0.05
-19.14%
1 ene 1984 año
0.228
+0.018
8.38%
1 ene 1985 año
0.178
-0.051
-22.12%
1 ene 1986 año
0.207
+0.029
16.51%
1 ene 1987 año
0.318
+0.111
53.66%
1 ene 1988 año
0.22
-0.098
-30.86%
1 ene 1989 año
0.469
+0.249
112.91%
1 ene 1990 año
0.524
+0.056
11.85%
1 ene 1991 año
0.547
+0.023
4.35%
1 ene 1992 año
0.566
+0.019
3.4%
1 ene 1993 año
0.413
-0.153
-27.0%
1 ene 1994 año
0.286
-0.127
-30.82%
1 ene 1995 año
0.891
+0.605
211.83%
1 ene 1996 año
0.888
-0.002
-0.28%
1 ene 1997 año
1.463
+0.574
64.64%
1 ene 1998 año
1.848
+0.385
26.35%
1 ene 1999 año
1.689
-0.159
-8.62%
1 ene 2000 año
2.225
+0.536
31.75%
1 ene 2001 año
1.481
-0.744
-33.43%
1 ene 2002 año
1.54
+0.059
4.0%
1 ene 2003 año
1.419
-0.121
-7.88%
1 ene 2004 año
1.385
-0.034
-2.41%
1 ene 2005 año
1.513
+0.129
9.29%
1 ene 2006 año
2.698
+1.184
78.26%
1 ene 2007 año
1.898
-0.799
-29.63%
1 ene 2008 año
2.556
+0.658
34.66%
1 ene 2009 año
3.49
+0.933
36.51%
1 ene 2010 año
4.259
+0.769
22.05%
1 ene 2011 año
3.855
-0.404
-9.48%
1 ene 2012 año
3.84
-0.015
-0.38%
1 ene 2013 año
4.157
+0.317
8.25%
1 ene 2014 año
3.591
-0.566
-13.62%
1 ene 2015 año
4.701
+1.11
30.9%
Ranking de los países por los datos estadísticos actuales


Comentarios: