29
/es/
es
AIzaSyAYiBZKx7MnpbEhh9jyipgxe19OcubqV5w
April 1, 2024
93395
Bulgaria
BGR
true
2
1
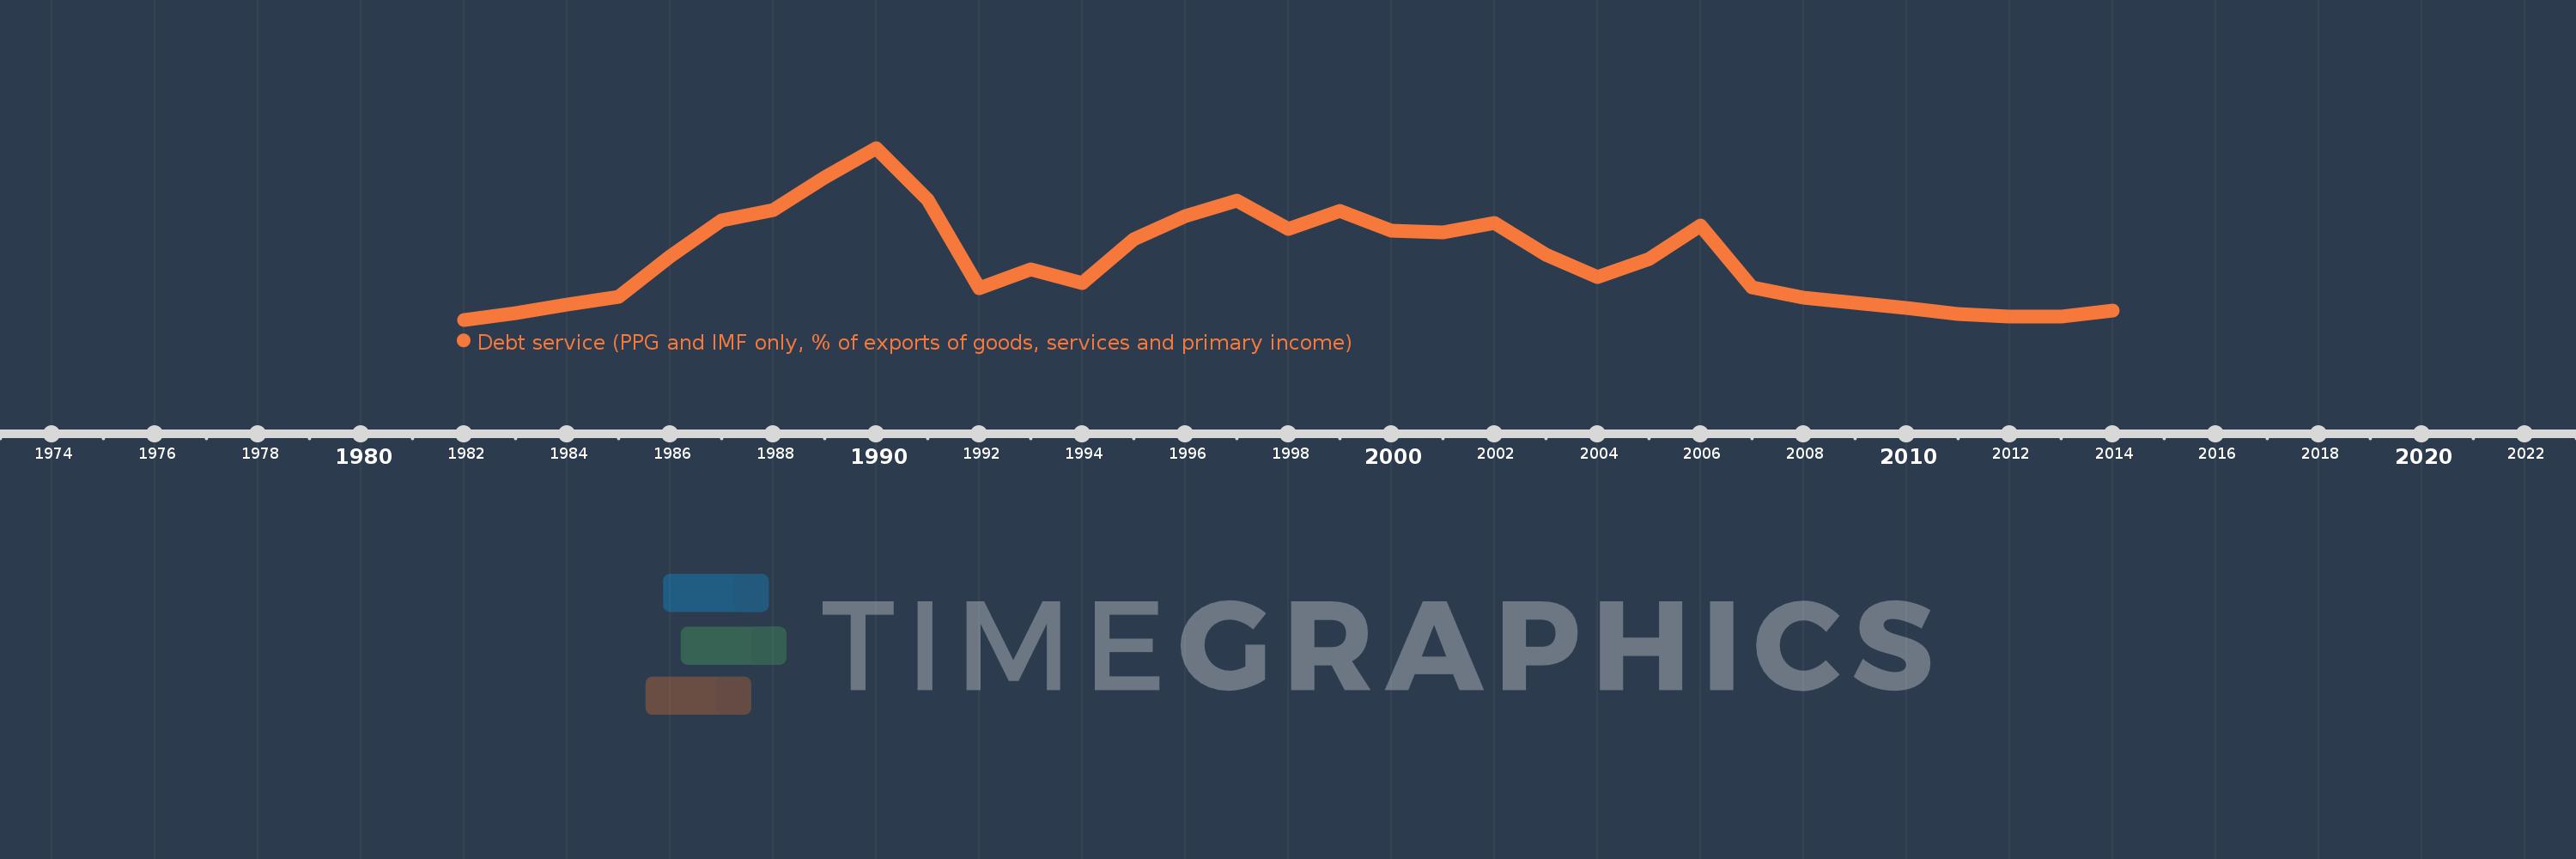
Debt service (PPG and IMF only, % of exports of goods, services and primary income)
2014,2013,2012,2011,2010,2009,2008,2007,2006,2005,2004,2003,2002,2001,2000,1999,1998,1997,1996,1995,1994,1993,1992,1991,1990,1989,1988,1987,1986,1985,1984,1983,1982
Estas estadísticas en otros países:
línea de tiempo (timeline):
En esta escala de tiempo se presenta un gráfico de 1982 y 2014 de Bulgaria. Los datos de 1981 están ausentes. El número de observaciones reales por fecha: 33.
Fuente (nombre):
Indicadores del desarrollo mundial
Fuente (organización):
World Bank, International Debt Statistics.
Categorías:
External Debt
Se ha actualizado:
23 abr 2017 año
Los indicadores de los cambios de valor en los últimos años
Mínimo:
0.715
1 ene 1982 año
Máximo:
26.288
1 ene 1990 año
A la fecha de observación
Valor
Cambio absoluto
El cambio con respecto al valor anterior
1 ene 1982 año
0.715
+0.715
0.0%
1 ene 1983 año
1.712
+0.997
139.44%
1 ene 1984 año
2.989
+1.277
74.56%
1 ene 1985 año
4.119
+1.13
37.79%
1 ene 1986 año
10.202
+6.083
147.68%
1 ene 1987 año
15.57
+5.368
52.62%
1 ene 1988 año
17.089
+1.519
9.75%
1 ene 1989 año
21.906
+4.818
28.19%
1 ene 1990 año
26.288
+4.381
20.0%
1 ene 1991 año
18.621
-7.667
-29.17%
1 ene 1992 año
5.403
-13.217
-70.98%
1 ene 1993 año
8.167
+2.764
51.15%
1 ene 1994 año
6.191
-1.975
-24.19%
1 ene 1995 año
12.727
+6.536
105.56%
1 ene 1996 año
16.119
+3.392
26.65%
1 ene 1997 año
18.454
+2.335
14.49%
1 ene 1998 año
14.218
-4.236
-22.95%
1 ene 1999 año
16.91
+2.692
18.93%
1 ene 2000 año
13.943
-2.967
-17.55%
1 ene 2001 año
13.729
-0.214
-1.54%
1 ene 2002 año
15.073
+1.344
9.79%
1 ene 2003 año
10.396
-4.677
-31.03%
1 ene 2004 año
7.089
-3.308
-31.82%
1 ene 2005 año
9.772
+2.683
37.86%
1 ene 2006 año
14.691
+4.919
50.33%
1 ene 2007 año
5.489
-9.202
-62.64%
1 ene 2008 año
3.97
-1.519
-27.67%
1 ene 2009 año
3.239
-0.731
-18.42%
1 ene 2010 año
2.518
-0.721
-22.25%
1 ene 2011 año
1.604
-0.914
-36.29%
1 ene 2012 año
1.222
-0.382
-23.83%
1 ene 2013 año
1.216
-0.006
-0.52%
1 ene 2014 año
2.021
+0.806
66.3%
Ranking de los países por los datos estadísticos actuales


Comentarios: