29
/es/
es
AIzaSyAYiBZKx7MnpbEhh9jyipgxe19OcubqV5w
April 1, 2024
38871
IDA only
IDX
false
2
1
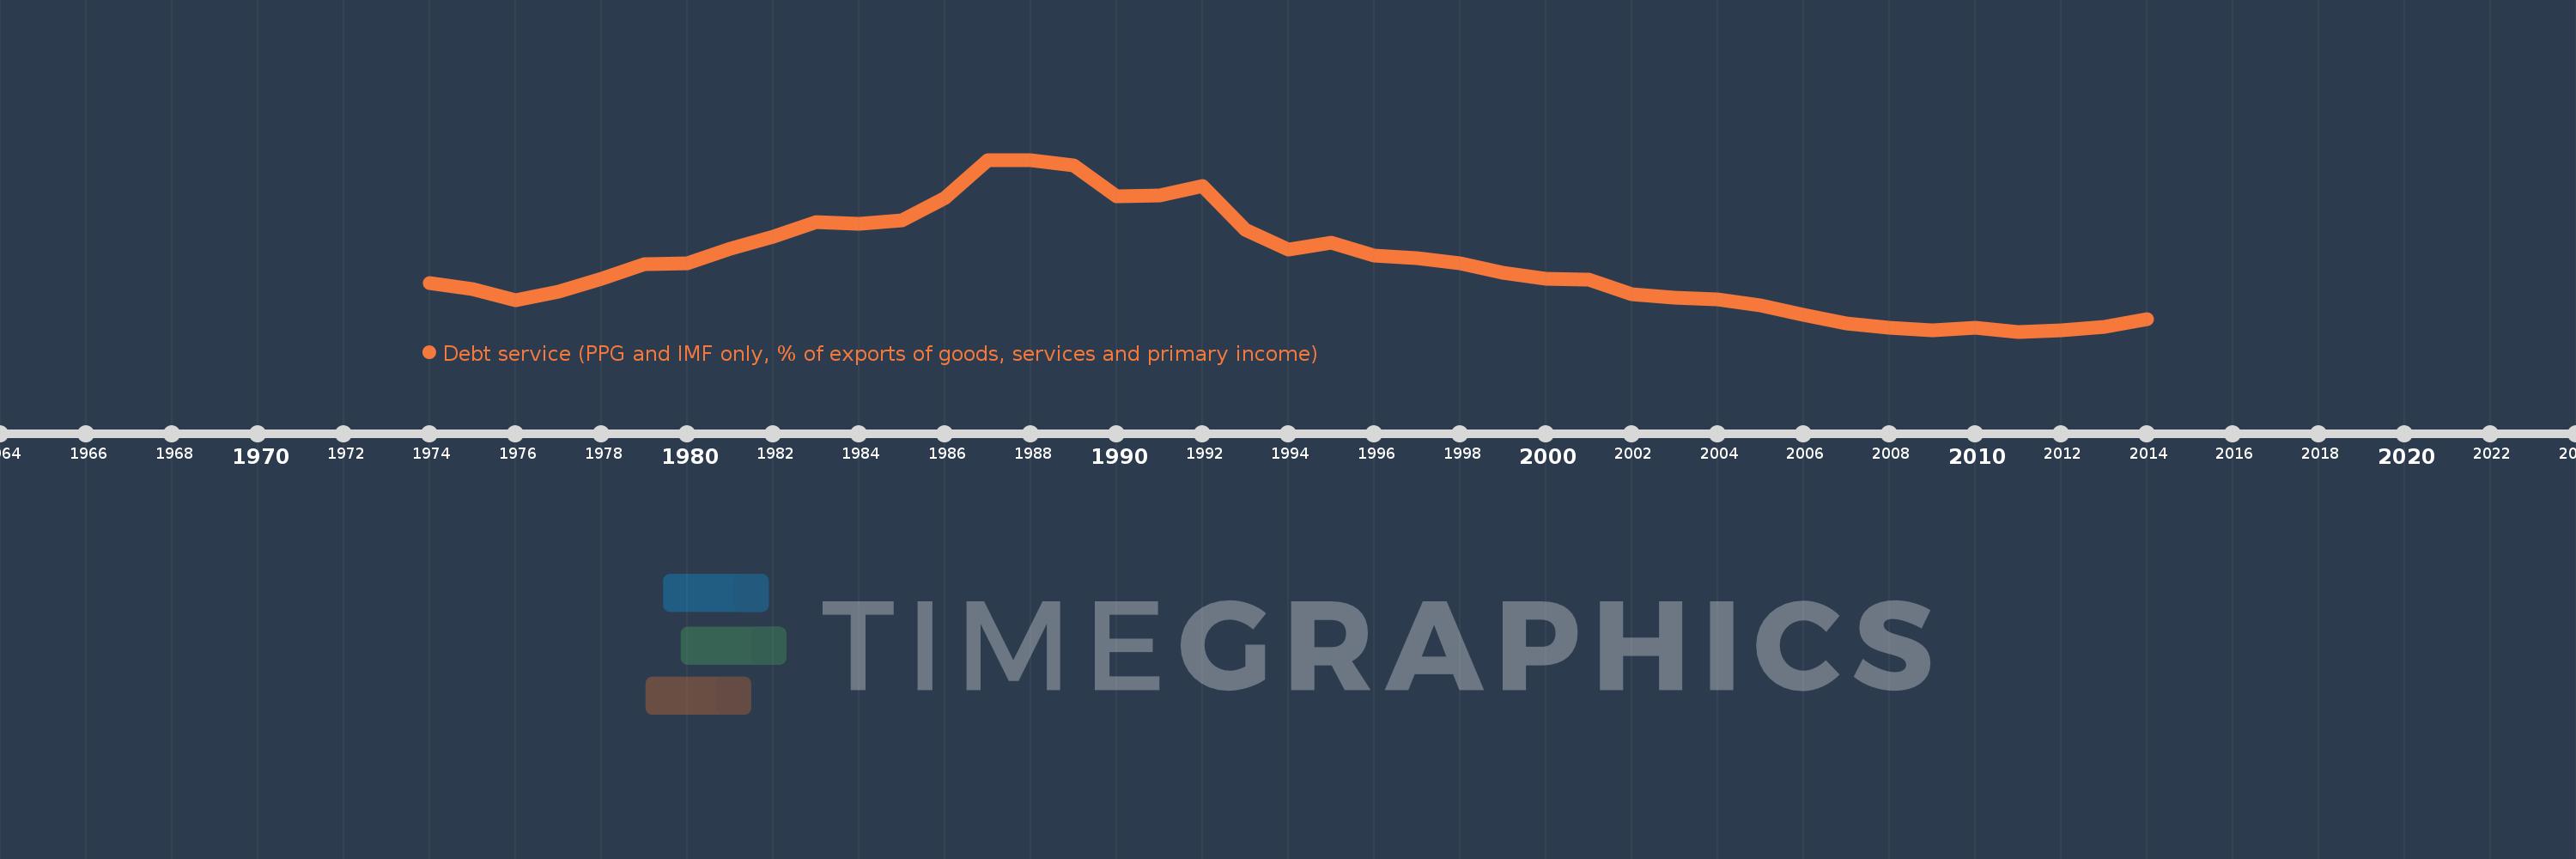
Debt service (PPG and IMF only, % of exports of goods, services and primary income)
2014,2013,2012,2011,2010,2009,2008,2007,2006,2005,2004,2003,2002,2001,2000,1999,1998,1997,1996,1995,1994,1993,1992,1991,1990,1989,1988,1987,1986,1985,1984,1983,1982,1981,1980,1979,1978,1977,1976,1975,1974
Estas estadísticas en otros países:
línea de tiempo (timeline):
En esta escala de tiempo se presenta un gráfico de 1974 y 2014 de IDA only. Los datos de 1973 están ausentes. El número de observaciones reales por fecha: 41.
Fuente (nombre):
Indicadores del desarrollo mundial
Fuente (organización):
World Bank, International Debt Statistics.
Categorías:
External Debt
Se ha actualizado:
23 abr 2017 año
Los indicadores de los cambios de valor en los últimos años
Mínimo:
3.006
1 ene 2011 año
Máximo:
28.026
1 ene 1988 año
A la fecha de observación
Valor
Cambio absoluto
El cambio con respecto al valor anterior
1 ene 1974 año
10.017
+10.017
0.0%
1 ene 1975 año
9.223
-0.794
-7.92%
1 ene 1976 año
7.606
-1.618
-17.54%
1 ene 1977 año
8.878
+1.272
16.73%
1 ene 1978 año
10.695
+1.817
20.46%
1 ene 1979 año
12.791
+2.096
19.6%
1 ene 1980 año
13.01
+0.219
1.71%
1 ene 1981 año
15.06
+2.05
15.76%
1 ene 1982 año
16.803
+1.743
11.57%
1 ene 1983 año
18.91
+2.107
12.54%
1 ene 1984 año
18.737
-0.173
-0.92%
1 ene 1985 año
19.194
+0.457
2.44%
1 ene 1986 año
22.521
+3.327
17.33%
1 ene 1987 año
27.93
+5.409
24.02%
1 ene 1988 año
28.026
+0.096
0.34%
1 ene 1989 año
27.168
-0.858
-3.06%
1 ene 1990 año
22.738
-4.43
-16.31%
1 ene 1991 año
22.819
+0.081
0.35%
1 ene 1992 año
24.184
+1.366
5.98%
1 ene 1993 año
17.844
-6.34
-26.22%
1 ene 1994 año
14.947
-2.897
-16.23%
1 ene 1995 año
15.957
+1.009
6.75%
1 ene 1996 año
14.093
-1.864
-11.68%
1 ene 1997 año
13.646
-0.447
-3.17%
1 ene 1998 año
12.933
-0.714
-5.23%
1 ene 1999 año
11.629
-1.304
-10.08%
1 ene 2000 año
10.708
-0.921
-7.92%
1 ene 2001 año
10.55
-0.158
-1.48%
1 ene 2002 año
8.447
-2.102
-19.93%
1 ene 2003 año
8.008
-0.439
-5.2%
1 ene 2004 año
7.756
-0.252
-3.15%
1 ene 2005 año
6.788
-0.968
-12.49%
1 ene 2006 año
5.494
-1.294
-19.06%
1 ene 2007 año
4.157
-1.337
-24.34%
1 ene 2008 año
3.52
-0.637
-15.32%
1 ene 2009 año
3.175
-0.344
-9.78%
1 ene 2010 año
3.583
+0.407
12.82%
1 ene 2011 año
3.006
-0.577
-16.09%
1 ene 2012 año
3.212
+0.206
6.86%
1 ene 2013 año
3.646
+0.434
13.5%
1 ene 2014 año
4.762
+1.116
30.62%
Ranking de los países por los datos estadísticos actuales


Comentarios: