29
/es/
es
AIzaSyAYiBZKx7MnpbEhh9jyipgxe19OcubqV5w
April 1, 2024
211552
Niger
NER
true
2
1
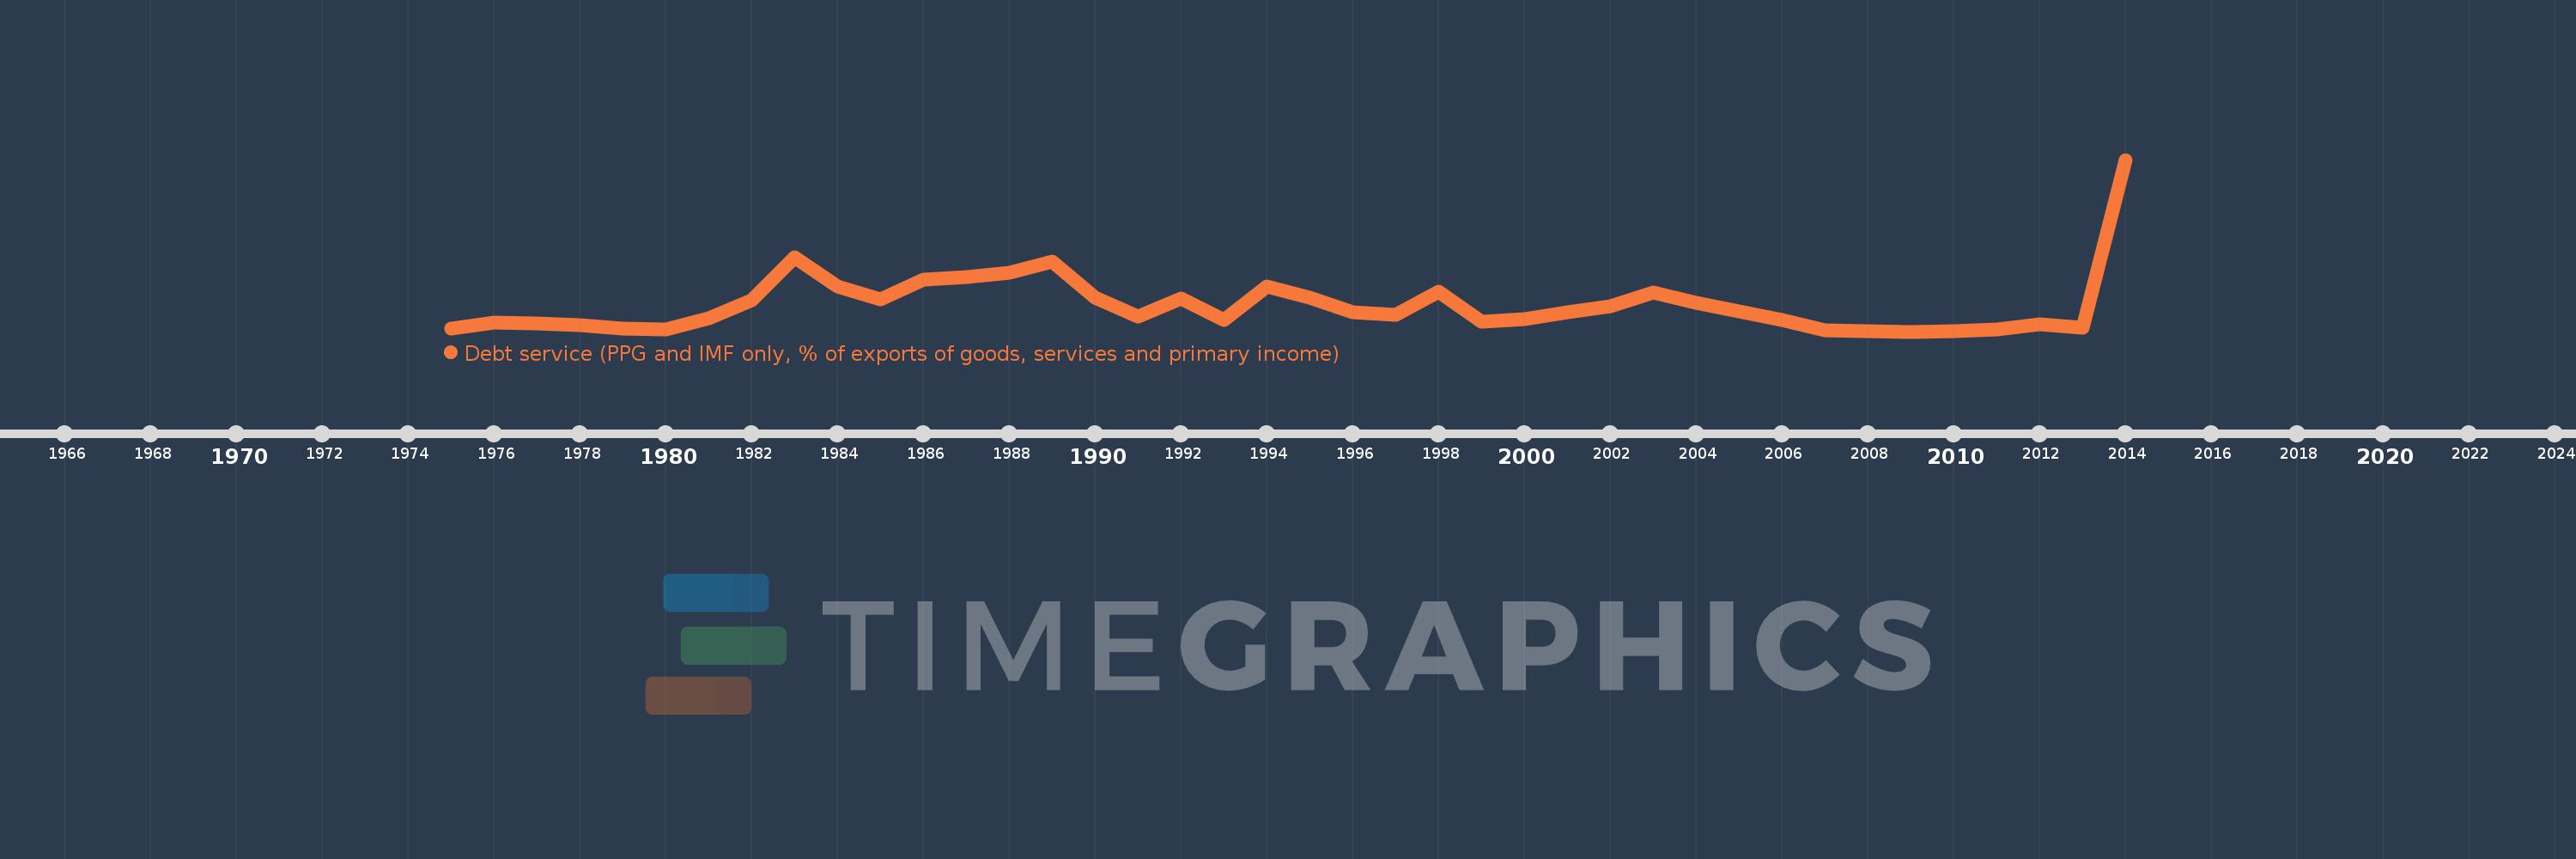
Debt service (PPG and IMF only, % of exports of goods, services and primary income)
2014,2013,2012,2011,2010,2009,2008,2007,2006,2005,2004,2003,2002,2001,2000,1999,1998,1997,1996,1995,1994,1993,1992,1991,1990,1989,1988,1987,1986,1985,1984,1983,1982,1981,1980,1979,1978,1977,1976,1975
Estas estadísticas en otros países:
línea de tiempo (timeline):
En esta escala de tiempo se presenta un gráfico de 1975 y 2014 de Niger. Los datos de 1974 están ausentes. El número de observaciones reales por fecha: 40.
Fuente (nombre):
Indicadores del desarrollo mundial
Fuente (organización):
World Bank, International Debt Statistics.
Categorías:
External Debt
Se ha actualizado:
23 abr 2017 año
Los indicadores de los cambios de valor en los últimos años
Mínimo:
1.82
1 ene 2009 año
Máximo:
56.069
1 ene 2014 año
A la fecha de observación
Valor
Cambio absoluto
El cambio con respecto al valor anterior
1 ene 1975 año
2.881
+2.881
0.0%
1 ene 1976 año
4.718
+1.837
63.77%
1 ene 1977 año
4.516
-0.202
-4.29%
1 ene 1978 año
3.944
-0.571
-12.65%
1 ene 1979 año
2.833
-1.111
-28.17%
1 ene 1980 año
2.462
-0.371
-13.09%
1 ene 1981 año
6.049
+3.587
145.67%
1 ene 1982 año
11.624
+5.575
92.15%
1 ene 1983 año
25.19
+13.566
116.71%
1 ene 1984 año
15.974
-9.216
-36.59%
1 ene 1985 año
12.077
-3.897
-24.39%
1 ene 1986 año
18.127
+6.05
50.1%
1 ene 1987 año
19.055
+0.927
5.11%
1 ene 1988 año
20.328
+1.273
6.68%
1 ene 1989 año
23.92
+3.592
17.67%
1 ene 1990 año
12.628
-11.292
-47.21%
1 ene 1991 año
6.595
-6.033
-47.78%
1 ene 1992 año
12.165
+5.571
84.47%
1 ene 1993 año
5.409
-6.756
-55.53%
1 ene 1994 año
15.964
+10.554
195.11%
1 ene 1995 año
12.611
-3.352
-21.0%
1 ene 1996 año
7.795
-4.817
-38.19%
1 ene 1997 año
7.064
-0.731
-9.37%
1 ene 1998 año
14.324
+7.26
102.78%
1 ene 1999 año
5.0
-9.324
-65.09%
1 ene 2000 año
5.876
+0.876
17.52%
1 ene 2001 año
7.908
+2.032
34.57%
1 ene 2002 año
9.879
+1.971
24.93%
1 ene 2003 año
14.074
+4.195
42.47%
1 ene 2004 año
10.901
-3.173
-22.55%
1 ene 2005 año
8.115
-2.786
-25.56%
1 ene 2006 año
5.58
-2.535
-31.24%
1 ene 2007 año
2.304
-3.276
-58.71%
1 ene 2008 año
1.937
-0.367
-15.92%
1 ene 2009 año
1.82
-0.117
-6.04%
1 ene 2010 año
1.992
+0.173
9.49%
1 ene 2011 año
2.372
+0.379
19.04%
1 ene 2012 año
4.076
+1.704
71.84%
1 ene 2013 año
3.134
-0.942
-23.1%
1 ene 2014 año
56.069
+52.934
1.69 mil%
Ranking de los países por los datos estadísticos actuales


Comentarios: