29
/es/
es
AIzaSyAYiBZKx7MnpbEhh9jyipgxe19OcubqV5w
April 1, 2024
92876
Brunei Darussalam
BRN
true
2
1
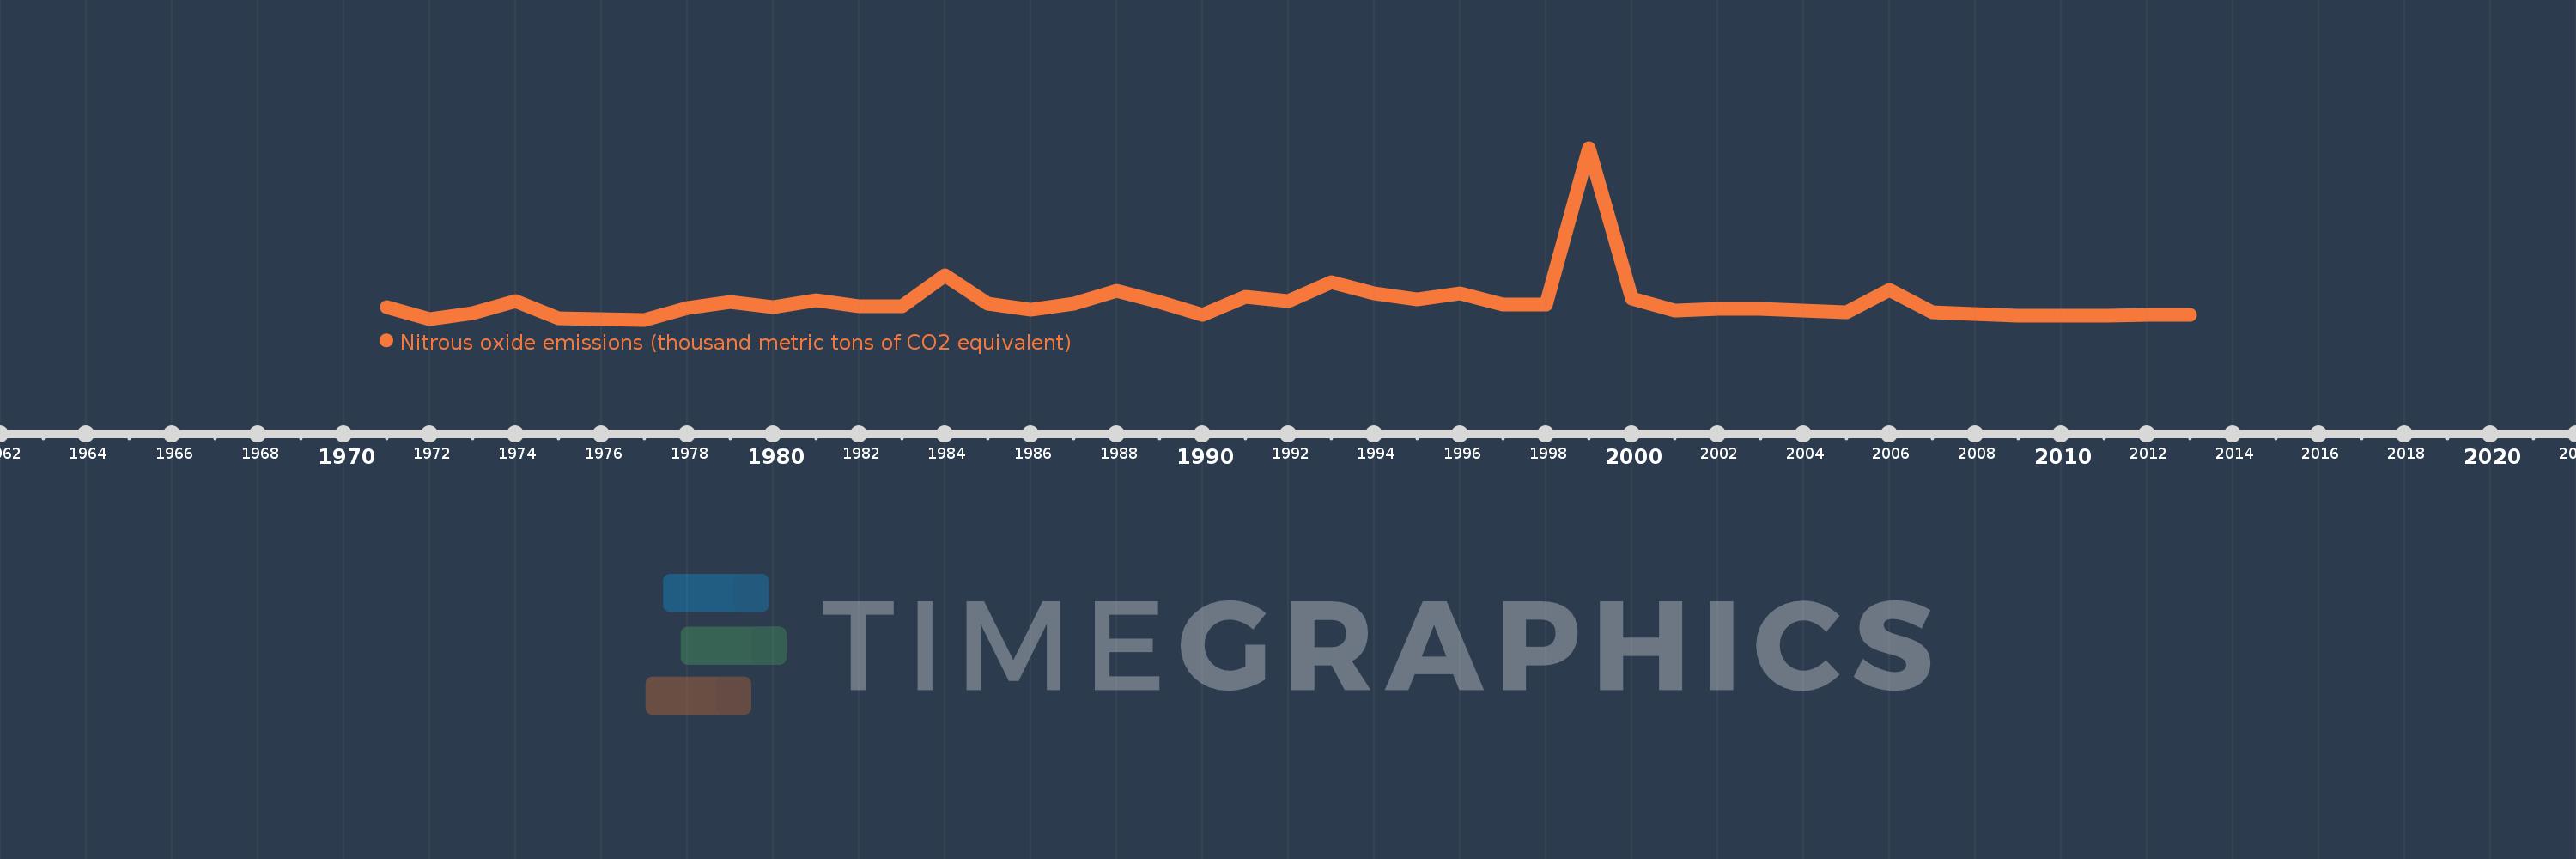
Nitrous oxide emissions (thousand metric tons of CO2 equivalent)
2013,2012,2011,2010,2009,2008,2007,2006,2005,2004,2003,2002,2001,2000,1999,1998,1997,1996,1995,1994,1993,1992,1991,1990,1989,1988,1987,1986,1985,1984,1983,1982,1981,1980,1979,1978,1977,1976,1975,1974,1973,1972,1971
Estas estadísticas en otros países:
AfghanistanAlbaniaAlgeriaAmerican SamoaAndorraAngolaAntigua and BarbudaArab WorldArgentinaArmeniaArubaAustraliaAustriaAzerbaijanBahamas, TheBahrainBangladeshBarbadosBelarusBelgiumBelizeBeninBermudaBhutanBoliviaBosnia and HerzegovinaBotswanaBrazilBritish Virgin IslandsBrunei DarussalamBulgariaBurkina FasoBurundiCabo VerdeCambodiaCameroonCanadaCaribbean small statesCayman IslandsCentral African RepublicCentral Europe and the BalticsChadChileChinaColombiaComorosCongo, Dem. Rep.Congo, Rep.Costa RicaCote d'IvoireCroatiaCubaCyprusCzech RepublicDenmarkDjiboutiDominicaDominican RepublicEarly-demographic dividendEast Asia & PacificEast Asia & Pacific (excluding high income)East Asia & Pacific (IDA & IBRD countries)EcuadorEgypt, Arab Rep.El SalvadorEquatorial GuineaEritreaEstoniaEthiopiaEuro areaEurope & Central AsiaEurope & Central Asia (excluding high income)Europe & Central Asia (IDA & IBRD countries)European UnionFaroe IslandsFijiFinlandFragile and conflict affected situationsFranceFrench PolynesiaGabonGambia, TheGeorgiaGermanyGhanaGibraltarGreeceGreenlandGrenadaGuamGuatemalaGuineaGuinea-BissauGuyanaHaitiHeavily indebted poor countries (HIPC)High incomeHondurasHong Kong SAR, ChinaHungaryIBRD onlyIcelandIDA & IBRD totalIDA blendIDA onlyIDA totalIndiaIndonesiaIran, Islamic Rep.IraqIrelandIsraelItalyJamaicaJapanJordanKazakhstanKenyaKiribatiKorea, Dem. People’s Rep.Korea, Rep.KosovoKuwaitKyrgyz RepublicLao PDRLate-demographic dividendLatin America & Caribbean Latin America & Caribbean (excluding high income)Latin America & the Caribbean (IDA & IBRD countries)LatviaLeast developed countries: UN classificationLebanonLesothoLiberiaLibyaLithuaniaLow & middle incomeLow incomeLower middle incomeLuxembourgMacao SAR, ChinaMacedonia, FYRMadagascarMalawiMalaysiaMaldivesMaliMaltaMarshall IslandsMauritaniaMauritiusMexicoMicronesia, Fed. Sts.Middle East & North AfricaMiddle East & North Africa (excluding high income)Middle East & North Africa (IDA & IBRD countries)Middle incomeMoldovaMongoliaMontenegroMoroccoMozambiqueMyanmarNamibiaNauruNepalNetherlandsNew CaledoniaNew ZealandNicaraguaNigerNigeriaNorth AmericaNorthern Mariana IslandsNorwayOECD membersOmanOther small statesPacific island small statesPakistanPalauPanamaPapua New GuineaParaguayPeruPhilippinesPolandPortugalPost-demographic dividendPre-demographic dividendPuerto RicoQatarRomaniaRussian FederationRwandaSamoaSao Tome and PrincipeSaudi ArabiaSenegalSerbiaSeychellesSierra LeoneSingaporeSlovak RepublicSloveniaSmall statesSolomon IslandsSomaliaSouth AfricaSouth AsiaSouth Asia (IDA & IBRD)SpainSri LankaSt. Kitts and NevisSt. LuciaSt. Vincent and the GrenadinesSub-Saharan Africa Sub-Saharan Africa (excluding high income)Sub-Saharan Africa (IDA & IBRD countries)SudanSurinameSwazilandSwedenSwitzerlandSyrian Arab RepublicTajikistanTanzaniaThailandTimor-LesteTogoTongaTrinidad and TobagoTunisiaTurkeyTurkmenistanTurks and Caicos IslandsTuvaluUgandaUkraineUnited Arab EmiratesUnited KingdomUnited StatesUpper middle incomeUruguayUzbekistanVanuatuVenezuela, RBVietnamVirgin Islands (U.S.)WorldYemen, Rep.ZambiaZimbabwe línea de tiempo (timeline):
En esta escala de tiempo se presenta un gráfico de 1971 y 2013 de Brunei Darussalam. Los datos de 1970 están ausentes. El número de observaciones reales por fecha: 43.
Fuente (nombre):
Indicadores del desarrollo mundial
Fuente (organización):
European Commission, Joint Research Centre (JRC)/Netherlands Environmental Assessment Agency (PBL). Emission Database for Global Atmospheric Research (EDGAR): http://edgar.jrc.ec.europa.eu/
Categorías:
Climate Change, Environment
Se ha actualizado:
23 abr 2017 año
Los indicadores de los cambios de valor en los últimos años
Mínimo:
280.463
1 ene 1977 año
Máximo:
2.423 mil
1 ene 1999 año
A la fecha de observación
Valor
Cambio absoluto
El cambio con respecto al valor anterior
1 ene 1971 año
439.89
+439.89
0.0%
1 ene 1972 año
291.047
-148.843
-33.84%
1 ene 1973 año
362.613
+71.567
24.59%
1 ene 1974 año
513.654
+151.041
41.65%
1 ene 1975 año
293.868
-219.786
-42.79%
1 ene 1976 año
287.711
-6.157
-2.1%
1 ene 1977 año
280.463
-7.248
-2.52%
1 ene 1978 año
423.46
+142.997
50.99%
1 ene 1979 año
507.613
+84.153
19.87%
1 ene 1980 año
439.76
-67.853
-13.37%
1 ene 1981 año
522.474
+82.714
18.81%
1 ene 1982 año
452.721
-69.753
-13.35%
1 ene 1983 año
451.456
-1.265
-0.28%
1 ene 1984 año
837.329
+385.873
85.47%
1 ene 1985 año
481.194
-356.134
-42.53%
1 ene 1986 año
407.693
-73.501
-15.27%
1 ene 1987 año
476.414
+68.721
16.86%
1 ene 1988 año
636.34
+159.926
33.57%
1 ene 1989 año
498.492
-137.848
-21.66%
1 ene 1990 año
344.088
-154.405
-30.97%
1 ene 1991 año
571.144
+227.056
65.99%
1 ene 1992 año
510.319
-60.825
-10.65%
1 ene 1993 año
747.401
+237.082
46.46%
1 ene 1994 año
608.821
-138.579
-18.54%
1 ene 1995 año
536.387
-72.435
-11.9%
1 ene 1996 año
613.36
+76.973
14.35%
1 ene 1997 año
465.462
-147.898
-24.11%
1 ene 1998 año
468.339
+2.877
0.62%
1 ene 1999 año
2.423 mil
+1.955 mil
417.44%
1 ene 2000 año
546.291
-1.877 mil
-77.46%
1 ene 2001 año
394.766
-151.525
-27.74%
1 ene 2002 año
417.923
+23.157
5.87%
1 ene 2003 año
411.534
-6.389
-1.53%
1 ene 2004 año
399.878
-11.656
-2.83%
1 ene 2005 año
370.596
-29.283
-7.32%
1 ene 2006 año
653.666
+283.07
76.38%
1 ene 2007 año
372.446
-281.22
-43.02%
1 ene 2008 año
351.67
-20.776
-5.58%
1 ene 2009 año
331.982
-19.688
-5.6%
1 ene 2010 año
334.041
+2.058
0.62%
1 ene 2011 año
335.659
+1.618
0.48%
1 ene 2012 año
339.015
+3.357
1.0%
1 ene 2013 año
342.372
+3.357
0.99%
Ranking de los países por los datos estadísticos actuales


Comentarios: