29
/es/
es
AIzaSyAYiBZKx7MnpbEhh9jyipgxe19OcubqV5w
April 1, 2024
147209
Guinea-Bissau
GNB
true
2
1
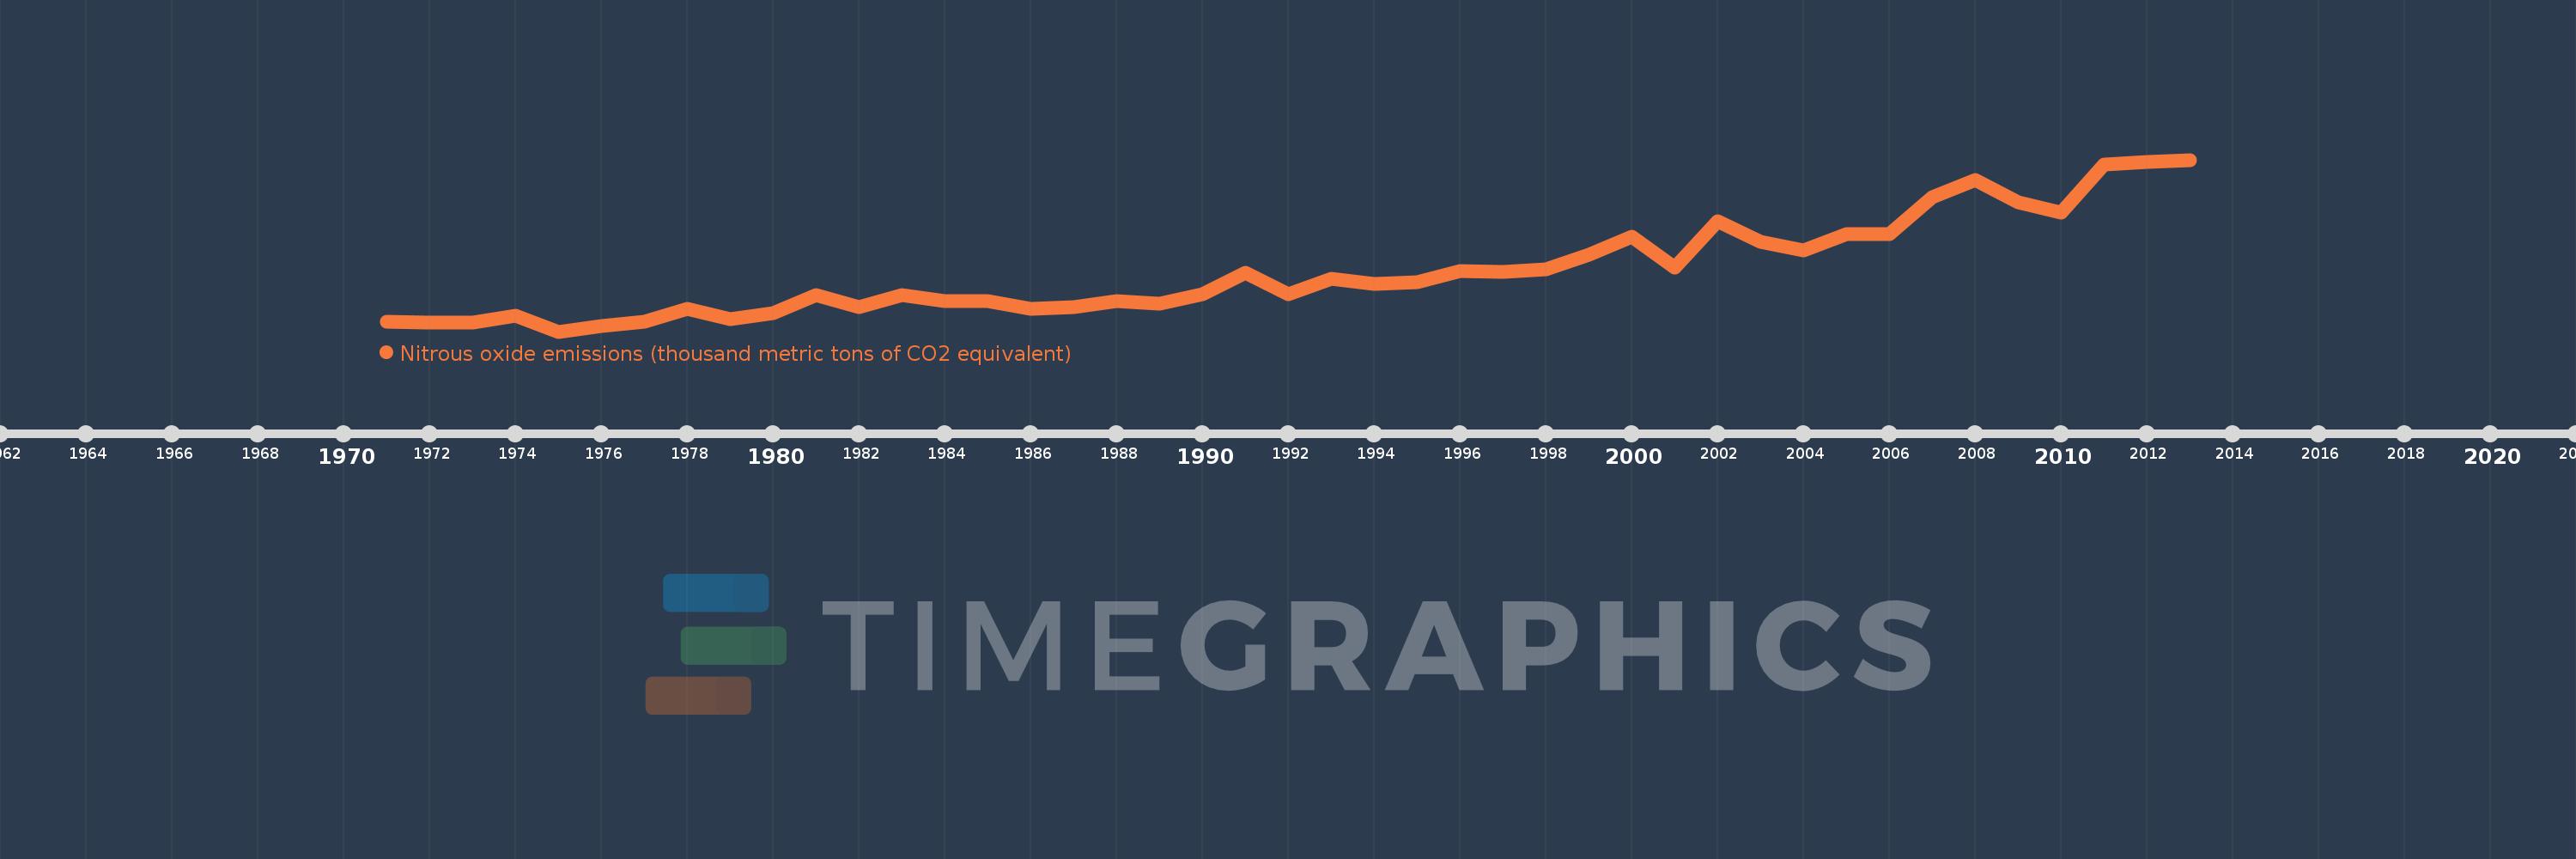
Nitrous oxide emissions (thousand metric tons of CO2 equivalent)
2013,2012,2011,2010,2009,2008,2007,2006,2005,2004,2003,2002,2001,2000,1999,1998,1997,1996,1995,1994,1993,1992,1991,1990,1989,1988,1987,1986,1985,1984,1983,1982,1981,1980,1979,1978,1977,1976,1975,1974,1973,1972,1971
Estas estadísticas en otros países:
AfghanistanAlbaniaAlgeriaAmerican SamoaAndorraAngolaAntigua and BarbudaArab WorldArgentinaArmeniaArubaAustraliaAustriaAzerbaijanBahamas, TheBahrainBangladeshBarbadosBelarusBelgiumBelizeBeninBermudaBhutanBoliviaBosnia and HerzegovinaBotswanaBrazilBritish Virgin IslandsBrunei DarussalamBulgariaBurkina FasoBurundiCabo VerdeCambodiaCameroonCanadaCaribbean small statesCayman IslandsCentral African RepublicCentral Europe and the BalticsChadChileChinaColombiaComorosCongo, Dem. Rep.Congo, Rep.Costa RicaCote d'IvoireCroatiaCubaCyprusCzech RepublicDenmarkDjiboutiDominicaDominican RepublicEarly-demographic dividendEast Asia & PacificEast Asia & Pacific (excluding high income)East Asia & Pacific (IDA & IBRD countries)EcuadorEgypt, Arab Rep.El SalvadorEquatorial GuineaEritreaEstoniaEthiopiaEuro areaEurope & Central AsiaEurope & Central Asia (excluding high income)Europe & Central Asia (IDA & IBRD countries)European UnionFaroe IslandsFijiFinlandFragile and conflict affected situationsFranceFrench PolynesiaGabonGambia, TheGeorgiaGermanyGhanaGibraltarGreeceGreenlandGrenadaGuamGuatemalaGuineaGuinea-BissauGuyanaHaitiHeavily indebted poor countries (HIPC)High incomeHondurasHong Kong SAR, ChinaHungaryIBRD onlyIcelandIDA & IBRD totalIDA blendIDA onlyIDA totalIndiaIndonesiaIran, Islamic Rep.IraqIrelandIsraelItalyJamaicaJapanJordanKazakhstanKenyaKiribatiKorea, Dem. People’s Rep.Korea, Rep.KosovoKuwaitKyrgyz RepublicLao PDRLate-demographic dividendLatin America & Caribbean Latin America & Caribbean (excluding high income)Latin America & the Caribbean (IDA & IBRD countries)LatviaLeast developed countries: UN classificationLebanonLesothoLiberiaLibyaLithuaniaLow & middle incomeLow incomeLower middle incomeLuxembourgMacao SAR, ChinaMacedonia, FYRMadagascarMalawiMalaysiaMaldivesMaliMaltaMarshall IslandsMauritaniaMauritiusMexicoMicronesia, Fed. Sts.Middle East & North AfricaMiddle East & North Africa (excluding high income)Middle East & North Africa (IDA & IBRD countries)Middle incomeMoldovaMongoliaMontenegroMoroccoMozambiqueMyanmarNamibiaNauruNepalNetherlandsNew CaledoniaNew ZealandNicaraguaNigerNigeriaNorth AmericaNorthern Mariana IslandsNorwayOECD membersOmanOther small statesPacific island small statesPakistanPalauPanamaPapua New GuineaParaguayPeruPhilippinesPolandPortugalPost-demographic dividendPre-demographic dividendPuerto RicoQatarRomaniaRussian FederationRwandaSamoaSao Tome and PrincipeSaudi ArabiaSenegalSerbiaSeychellesSierra LeoneSingaporeSlovak RepublicSloveniaSmall statesSolomon IslandsSomaliaSouth AfricaSouth AsiaSouth Asia (IDA & IBRD)SpainSri LankaSt. Kitts and NevisSt. LuciaSt. Vincent and the GrenadinesSub-Saharan Africa Sub-Saharan Africa (excluding high income)Sub-Saharan Africa (IDA & IBRD countries)SudanSurinameSwazilandSwedenSwitzerlandSyrian Arab RepublicTajikistanTanzaniaThailandTimor-LesteTogoTongaTrinidad and TobagoTunisiaTurkeyTurkmenistanTurks and Caicos IslandsTuvaluUgandaUkraineUnited Arab EmiratesUnited KingdomUnited StatesUpper middle incomeUruguayUzbekistanVanuatuVenezuela, RBVietnamVirgin Islands (U.S.)WorldYemen, Rep.ZambiaZimbabwe línea de tiempo (timeline):
En esta escala de tiempo se presenta un gráfico de 1971 y 2013 de Guinea-Bissau. Los datos de 1970 están ausentes. El número de observaciones reales por fecha: 43.
Fuente (nombre):
Indicadores del desarrollo mundial
Fuente (organización):
European Commission, Joint Research Centre (JRC)/Netherlands Environmental Assessment Agency (PBL). Emission Database for Global Atmospheric Research (EDGAR): http://edgar.jrc.ec.europa.eu/
Categorías:
Climate Change, Environment
Se ha actualizado:
23 abr 2017 año
Los indicadores de los cambios de valor en los últimos años
Mínimo:
286.976
1 ene 1975 año
Máximo:
989.624
1 ene 2013 año
A la fecha de observación
Valor
Cambio absoluto
El cambio con respecto al valor anterior
1 ene 1971 año
328.581
+328.581
0.0%
1 ene 1972 año
323.522
-5.059
-1.54%
1 ene 1973 año
323.445
-0.077
-0.02%
1 ene 1974 año
350.582
+27.137
8.39%
1 ene 1975 año
286.976
-63.606
-18.14%
1 ene 1976 año
310.356
+23.381
8.15%
1 ene 1977 año
326.979
+16.622
5.36%
1 ene 1978 año
379.3
+52.322
16.0%
1 ene 1979 año
336.703
-42.597
-11.23%
1 ene 1980 año
363.112
+26.409
7.84%
1 ene 1981 año
437.72
+74.608
20.55%
1 ene 1982 año
387.829
-49.891
-11.4%
1 ene 1983 año
435.119
+47.291
12.19%
1 ene 1984 año
411.869
-23.25
-5.34%
1 ene 1985 año
411.32
-0.549
-0.13%
1 ene 1986 año
379.378
-31.942
-7.77%
1 ene 1987 año
388.65
+9.272
2.44%
1 ene 1988 año
411.959
+23.309
6.0%
1 ene 1989 año
399.646
-12.313
-2.99%
1 ene 1990 año
441.353
+41.707
10.44%
1 ene 1991 año
527.053
+85.699
19.42%
1 ene 1992 año
441.133
-85.92
-16.3%
1 ene 1993 año
501.313
+60.18
13.64%
1 ene 1994 año
483.464
-17.85
-3.56%
1 ene 1995 año
488.678
+5.214
1.08%
1 ene 1996 año
532.905
+44.228
9.05%
1 ene 1997 año
530.525
-2.381
-0.45%
1 ene 1998 año
541.967
+11.442
2.16%
1 ene 1999 año
599.689
+57.722
10.65%
1 ene 2000 año
675.856
+76.167
12.7%
1 ene 2001 año
549.332
-126.523
-18.72%
1 ene 2002 año
737.264
+187.931
34.21%
1 ene 2003 año
653.499
-83.765
-11.36%
1 ene 2004 año
617.464
-36.034
-5.51%
1 ene 2005 año
685.432
+67.967
11.01%
1 ene 2006 año
684.588
-0.843
-0.12%
1 ene 2007 año
836.622
+152.033
22.21%
1 ene 2008 año
906.093
+69.471
8.3%
1 ene 2009 año
814.023
-92.07
-10.16%
1 ene 2010 año
772.573
-41.45
-5.09%
1 ene 2011 año
970.219
+197.647
25.58%
1 ene 2012 año
979.922
+9.702
1.0%
1 ene 2013 año
989.624
+9.702
0.99%
Ranking de los países por los datos estadísticos actuales


Comentarios: