29
/es/
es
AIzaSyAYiBZKx7MnpbEhh9jyipgxe19OcubqV5w
April 1, 2024
162980
Jamaica
JAM
true
2
1
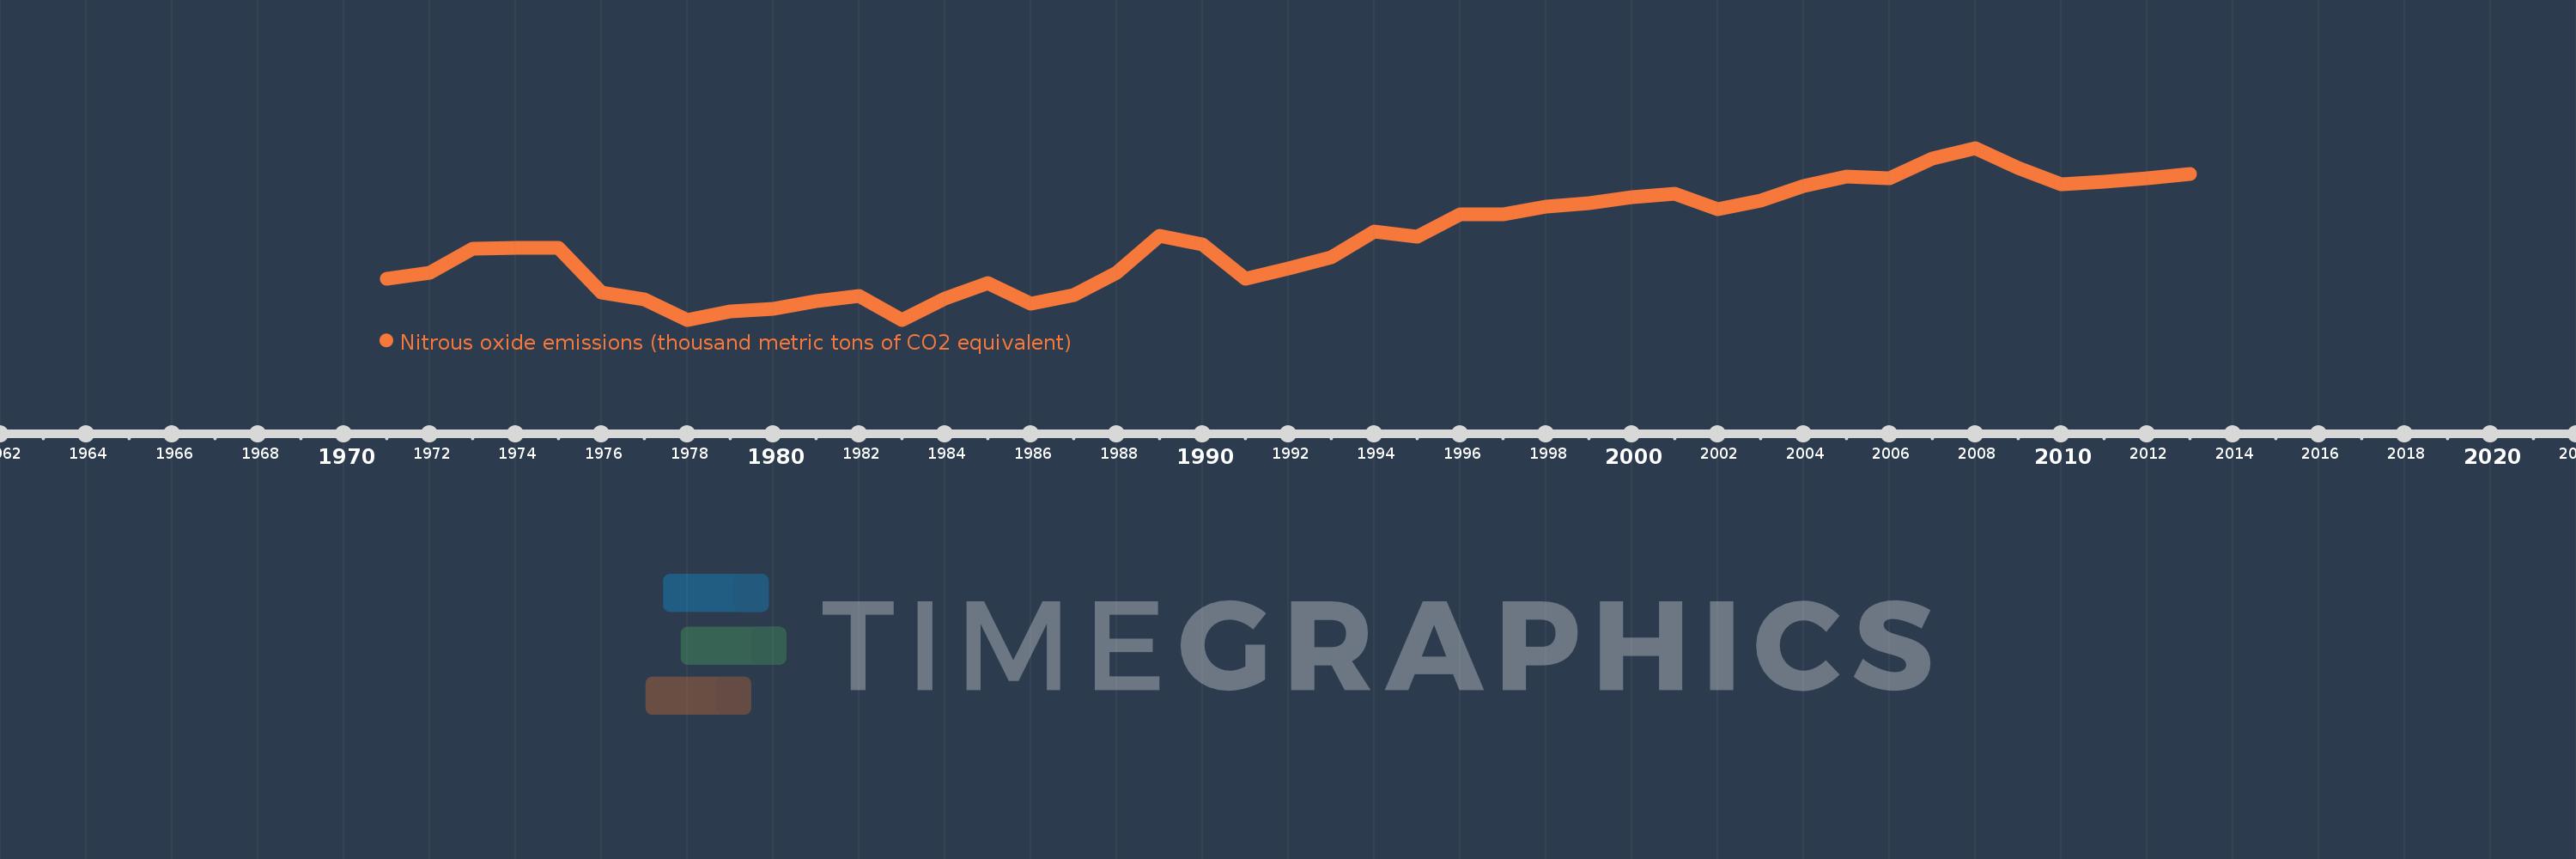
Nitrous oxide emissions (thousand metric tons of CO2 equivalent)
2013,2012,2011,2010,2009,2008,2007,2006,2005,2004,2003,2002,2001,2000,1999,1998,1997,1996,1995,1994,1993,1992,1991,1990,1989,1988,1987,1986,1985,1984,1983,1982,1981,1980,1979,1978,1977,1976,1975,1974,1973,1972,1971
Estas estadísticas en otros países:
AfghanistanAlbaniaAlgeriaAmerican SamoaAndorraAngolaAntigua and BarbudaArab WorldArgentinaArmeniaArubaAustraliaAustriaAzerbaijanBahamas, TheBahrainBangladeshBarbadosBelarusBelgiumBelizeBeninBermudaBhutanBoliviaBosnia and HerzegovinaBotswanaBrazilBritish Virgin IslandsBrunei DarussalamBulgariaBurkina FasoBurundiCabo VerdeCambodiaCameroonCanadaCaribbean small statesCayman IslandsCentral African RepublicCentral Europe and the BalticsChadChileChinaColombiaComorosCongo, Dem. Rep.Congo, Rep.Costa RicaCote d'IvoireCroatiaCubaCyprusCzech RepublicDenmarkDjiboutiDominicaDominican RepublicEarly-demographic dividendEast Asia & PacificEast Asia & Pacific (excluding high income)East Asia & Pacific (IDA & IBRD countries)EcuadorEgypt, Arab Rep.El SalvadorEquatorial GuineaEritreaEstoniaEthiopiaEuro areaEurope & Central AsiaEurope & Central Asia (excluding high income)Europe & Central Asia (IDA & IBRD countries)European UnionFaroe IslandsFijiFinlandFragile and conflict affected situationsFranceFrench PolynesiaGabonGambia, TheGeorgiaGermanyGhanaGibraltarGreeceGreenlandGrenadaGuamGuatemalaGuineaGuinea-BissauGuyanaHaitiHeavily indebted poor countries (HIPC)High incomeHondurasHong Kong SAR, ChinaHungaryIBRD onlyIcelandIDA & IBRD totalIDA blendIDA onlyIDA totalIndiaIndonesiaIran, Islamic Rep.IraqIrelandIsraelItalyJamaicaJapanJordanKazakhstanKenyaKiribatiKorea, Dem. People’s Rep.Korea, Rep.KosovoKuwaitKyrgyz RepublicLao PDRLate-demographic dividendLatin America & Caribbean Latin America & Caribbean (excluding high income)Latin America & the Caribbean (IDA & IBRD countries)LatviaLeast developed countries: UN classificationLebanonLesothoLiberiaLibyaLithuaniaLow & middle incomeLow incomeLower middle incomeLuxembourgMacao SAR, ChinaMacedonia, FYRMadagascarMalawiMalaysiaMaldivesMaliMaltaMarshall IslandsMauritaniaMauritiusMexicoMicronesia, Fed. Sts.Middle East & North AfricaMiddle East & North Africa (excluding high income)Middle East & North Africa (IDA & IBRD countries)Middle incomeMoldovaMongoliaMontenegroMoroccoMozambiqueMyanmarNamibiaNauruNepalNetherlandsNew CaledoniaNew ZealandNicaraguaNigerNigeriaNorth AmericaNorthern Mariana IslandsNorwayOECD membersOmanOther small statesPacific island small statesPakistanPalauPanamaPapua New GuineaParaguayPeruPhilippinesPolandPortugalPost-demographic dividendPre-demographic dividendPuerto RicoQatarRomaniaRussian FederationRwandaSamoaSao Tome and PrincipeSaudi ArabiaSenegalSerbiaSeychellesSierra LeoneSingaporeSlovak RepublicSloveniaSmall statesSolomon IslandsSomaliaSouth AfricaSouth AsiaSouth Asia (IDA & IBRD)SpainSri LankaSt. Kitts and NevisSt. LuciaSt. Vincent and the GrenadinesSub-Saharan Africa Sub-Saharan Africa (excluding high income)Sub-Saharan Africa (IDA & IBRD countries)SudanSurinameSwazilandSwedenSwitzerlandSyrian Arab RepublicTajikistanTanzaniaThailandTimor-LesteTogoTongaTrinidad and TobagoTunisiaTurkeyTurkmenistanTurks and Caicos IslandsTuvaluUgandaUkraineUnited Arab EmiratesUnited KingdomUnited StatesUpper middle incomeUruguayUzbekistanVanuatuVenezuela, RBVietnamVirgin Islands (U.S.)WorldYemen, Rep.ZambiaZimbabwe línea de tiempo (timeline):
En esta escala de tiempo se presenta un gráfico de 1971 y 2013 de Jamaica. Los datos de 1970 están ausentes. El número de observaciones reales por fecha: 43.
Fuente (nombre):
Indicadores del desarrollo mundial
Fuente (organización):
European Commission, Joint Research Centre (JRC)/Netherlands Environmental Assessment Agency (PBL). Emission Database for Global Atmospheric Research (EDGAR): http://edgar.jrc.ec.europa.eu/
Categorías:
Climate Change, Environment
Se ha actualizado:
23 abr 2017 año
Los indicadores de los cambios de valor en los últimos años
Mínimo:
410.896
1 ene 1978 año
Máximo:
700.067
1 ene 2008 año
A la fecha de observación
Valor
Cambio absoluto
El cambio con respecto al valor anterior
1 ene 1971 año
479.985
+479.985
0.0%
1 ene 1972 año
489.834
+9.849
2.05%
1 ene 1973 año
529.861
+40.027
8.17%
1 ene 1974 año
531.362
+1.5
0.28%
1 ene 1975 año
531.783
+0.422
0.08%
1 ene 1976 año
457.07
-74.713
-14.05%
1 ene 1977 año
445.665
-11.405
-2.5%
1 ene 1978 año
410.896
-34.77
-7.8%
1 ene 1979 año
424.839
+13.944
3.39%
1 ene 1980 año
429.551
+4.712
1.11%
1 ene 1981 año
442.103
+12.552
2.92%
1 ene 1982 año
450.979
+8.875
2.01%
1 ene 1983 año
411.041
-39.937
-8.86%
1 ene 1984 año
446.062
+35.021
8.52%
1 ene 1985 año
473.051
+26.989
6.05%
1 ene 1986 año
437.444
-35.607
-7.53%
1 ene 1987 año
452.479
+15.035
3.44%
1 ene 1988 año
490.048
+37.569
8.3%
1 ene 1989 año
552.008
+61.96
12.64%
1 ene 1990 año
537.546
-14.462
-2.62%
1 ene 1991 año
479.26
-58.286
-10.84%
1 ene 1992 año
497.491
+18.231
3.8%
1 ene 1993 año
515.79
+18.299
3.68%
1 ene 1994 año
559.829
+44.039
8.54%
1 ene 1995 año
550.82
-9.009
-1.61%
1 ene 1996 año
588.138
+37.318
6.77%
1 ene 1997 año
588.138
0.0
0.0%
1 ene 1998 año
600.603
+12.465
2.12%
1 ene 1999 año
606.49
+5.887
0.98%
1 ene 2000 año
616.733
+10.242
1.69%
1 ene 2001 año
623.292
+6.56
1.06%
1 ene 2002 año
597.373
-25.919
-4.16%
1 ene 2003 año
611.388
+14.015
2.35%
1 ene 2004 año
636.631
+25.243
4.13%
1 ene 2005 año
652.008
+15.376
2.42%
1 ene 2006 año
649.345
-2.663
-0.41%
1 ene 2007 año
681.674
+32.33
4.98%
1 ene 2008 año
700.067
+18.392
2.7%
1 ene 2009 año
666.007
-34.06
-4.87%
1 ene 2010 año
638.281
-27.726
-4.16%
1 ene 2011 año
643.256
+4.976
0.78%
1 ene 2012 año
649.689
+6.433
1.0%
1 ene 2013 año
656.121
+6.433
0.99%
Ranking de los países por los datos estadísticos actuales


Comentarios: