29
/es/
es
AIzaSyAYiBZKx7MnpbEhh9jyipgxe19OcubqV5w
April 1, 2024
86961
Bolivia
BOL
true
2
1
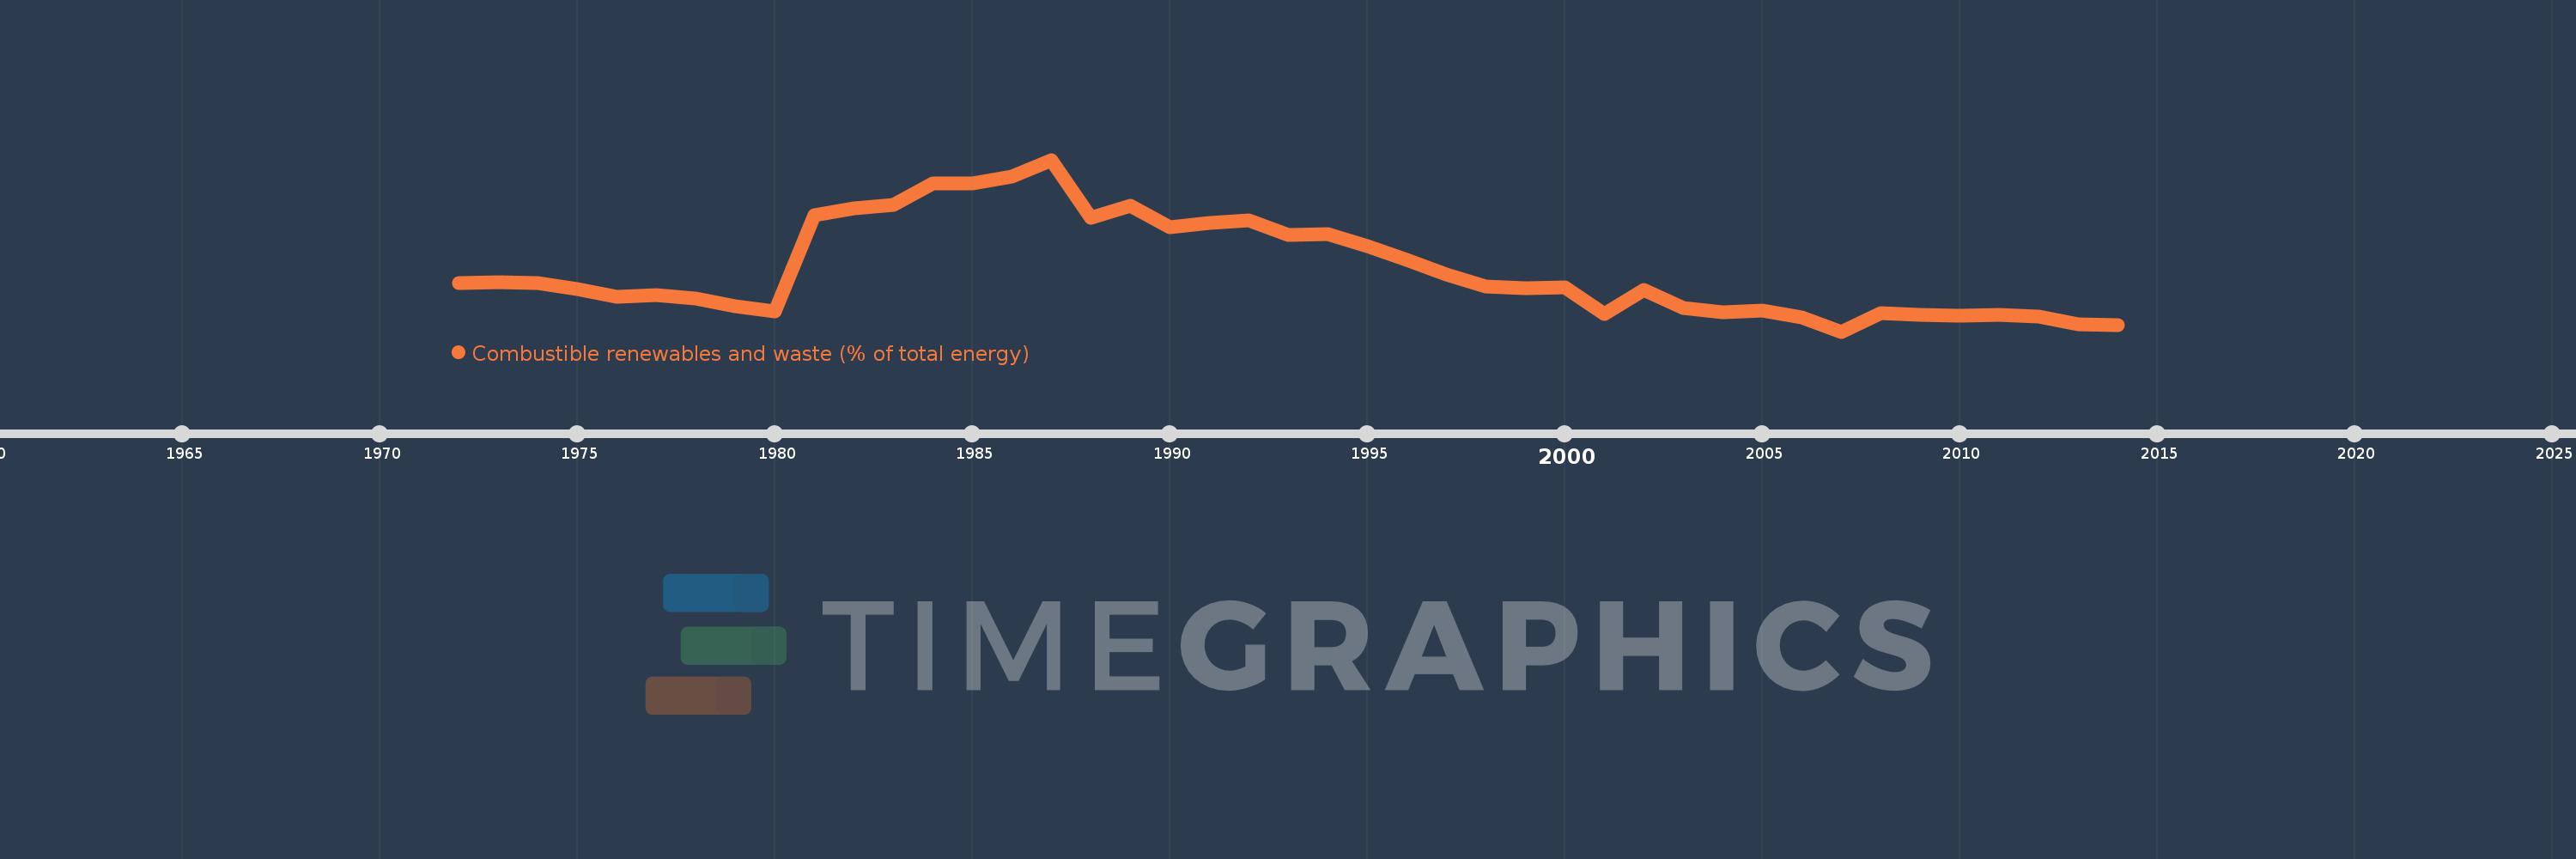
Combustible renewables and waste (% of total energy)
2014,2013,2012,2011,2010,2009,2008,2007,2006,2005,2004,2003,2002,2001,2000,1999,1998,1997,1996,1995,1994,1993,1992,1991,1990,1989,1988,1987,1986,1985,1984,1983,1982,1981,1980,1979,1978,1977,1976,1975,1974,1973,1972
Estas estadísticas en otros países:
AlbaniaAlgeriaAngolaArab WorldArgentinaArmeniaAustraliaAustriaAzerbaijanBahrainBangladeshBelarusBelgiumBeninBoliviaBosnia and HerzegovinaBotswanaBrazilBrunei DarussalamBulgariaCambodiaCameroonCanadaCaribbean small statesCentral Europe and the BalticsChileChinaColombiaCongo, Dem. Rep.Congo, Rep.Costa RicaCote d'IvoireCroatiaCubaCuracaoCyprusCzech RepublicDenmarkDominican RepublicEarly-demographic dividendEast Asia & PacificEast Asia & Pacific (excluding high income)East Asia & Pacific (IDA & IBRD countries)EcuadorEgypt, Arab Rep.El SalvadorEritreaEstoniaEthiopiaEuro areaEurope & Central AsiaEurope & Central Asia (excluding high income)Europe & Central Asia (IDA & IBRD countries)European UnionFinlandFragile and conflict affected situationsFranceGabonGeorgiaGermanyGhanaGibraltarGreeceGuatemalaHaitiHeavily indebted poor countries (HIPC)High incomeHondurasHong Kong SAR, ChinaHungaryIBRD onlyIcelandIDA & IBRD totalIDA blendIDA onlyIDA totalIndiaIndonesiaIran, Islamic Rep.IraqIrelandIsraelItalyJamaicaJapanJordanKazakhstanKenyaKorea, Dem. People’s Rep.Korea, Rep.KosovoKuwaitKyrgyz RepublicLate-demographic dividendLatin America & Caribbean Latin America & Caribbean (excluding high income)Latin America & the Caribbean (IDA & IBRD countries)LatviaLeast developed countries: UN classificationLebanonLibyaLithuaniaLow & middle incomeLow incomeLower middle incomeLuxembourgMacedonia, FYRMalaysiaMaltaMauritiusMexicoMiddle East & North AfricaMiddle East & North Africa (excluding high income)Middle East & North Africa (IDA & IBRD countries)Middle incomeMoldovaMongoliaMontenegroMoroccoMozambiqueMyanmarNamibiaNepalNetherlandsNew ZealandNicaraguaNigerNigeriaNorth AmericaNorwayOECD membersOmanOther small statesPakistanPanamaParaguayPeruPhilippinesPolandPortugalPost-demographic dividendPre-demographic dividendQatarRomaniaRussian FederationSaudi ArabiaSenegalSerbiaSingaporeSlovak RepublicSloveniaSmall statesSouth AfricaSouth AsiaSouth Asia (IDA & IBRD)South SudanSpainSri LankaSub-Saharan Africa Sub-Saharan Africa (excluding high income)Sub-Saharan Africa (IDA & IBRD countries)SudanSwedenSwitzerlandSyrian Arab RepublicTajikistanTanzaniaThailandTogoTrinidad and TobagoTunisiaTurkeyTurkmenistanUkraineUnited Arab EmiratesUnited KingdomUnited StatesUpper middle incomeUruguayUzbekistanVenezuela, RBVietnamWorldYemen, Rep.ZambiaZimbabwe línea de tiempo (timeline):
En esta escala de tiempo se presenta un gráfico de 1972 y 2014 de Bolivia. Los datos de 1971 están ausentes. El número de observaciones reales por fecha: 43.
Fuente (nombre):
Indicadores del desarrollo mundial
Fuente (organización):
IEA Statistics © OECD/IEA 2014 (http://www.iea.org/stats/index.asp), subject to https://www.iea.org/t&c/termsandconditions/
Categorías:
Energy & Mining
Se ha actualizado:
23 abr 2017 año
Los indicadores de los cambios de valor en los últimos años
Mínimo:
11.195
1 ene 2007 año
Máximo:
39.222
1 ene 1987 año
A la fecha de observación
Valor
Cambio absoluto
El cambio con respecto al valor anterior
1 ene 1972 año
19.067
+19.067
0.0%
1 ene 1973 año
19.239
+0.171
0.9%
1 ene 1974 año
19.126
-0.113
-0.59%
1 ene 1975 año
18.066
-1.06
-5.54%
1 ene 1976 año
16.899
-1.167
-6.46%
1 ene 1977 año
17.083
+0.185
1.09%
1 ene 1978 año
16.604
-0.479
-2.81%
1 ene 1979 año
15.321
-1.283
-7.73%
1 ene 1980 año
14.529
-0.792
-5.17%
1 ene 1981 año
30.12
+15.592
107.32%
1 ene 1982 año
31.276
+1.156
3.84%
1 ene 1983 año
31.899
+0.623
1.99%
1 ene 1984 año
35.36
+3.461
10.85%
1 ene 1985 año
35.408
+0.047
0.13%
1 ene 1986 año
36.503
+1.095
3.09%
1 ene 1987 año
39.222
+2.719
7.45%
1 ene 1988 año
29.704
-9.518
-24.27%
1 ene 1989 año
31.657
+1.952
6.57%
1 ene 1990 año
28.284
-3.373
-10.65%
1 ene 1991 año
28.88
+0.596
2.11%
1 ene 1992 año
29.29
+0.409
1.42%
1 ene 1993 año
26.939
-2.351
-8.03%
1 ene 1994 año
27.156
+0.218
0.81%
1 ene 1995 año
25.101
-2.055
-7.57%
1 ene 1996 año
22.879
-2.222
-8.85%
1 ene 1997 año
20.466
-2.414
-10.55%
1 ene 1998 año
18.584
-1.881
-9.19%
1 ene 1999 año
18.206
-0.378
-2.04%
1 ene 2000 año
18.342
+0.136
0.75%
1 ene 2001 año
14.023
-4.319
-23.54%
1 ene 2002 año
17.999
+3.976
28.35%
1 ene 2003 año
14.995
-3.004
-16.69%
1 ene 2004 año
14.406
-0.589
-3.93%
1 ene 2005 año
14.575
+0.169
1.17%
1 ene 2006 año
13.548
-1.028
-7.05%
1 ene 2007 año
11.195
-2.353
-17.37%
1 ene 2008 año
14.199
+3.004
26.83%
1 ene 2009 año
13.878
-0.32
-2.25%
1 ene 2010 año
13.852
-0.027
-0.19%
1 ene 2011 año
13.909
+0.058
0.42%
1 ene 2012 año
13.693
-0.216
-1.55%
1 ene 2013 año
12.382
-1.311
-9.57%
1 ene 2014 año
12.231
-0.151
-1.22%
Ranking de los países por los datos estadísticos actuales


Comentarios: