29
/es/
es
AIzaSyAYiBZKx7MnpbEhh9jyipgxe19OcubqV5w
April 1, 2024
179818
Libya
LBY
true
2
1
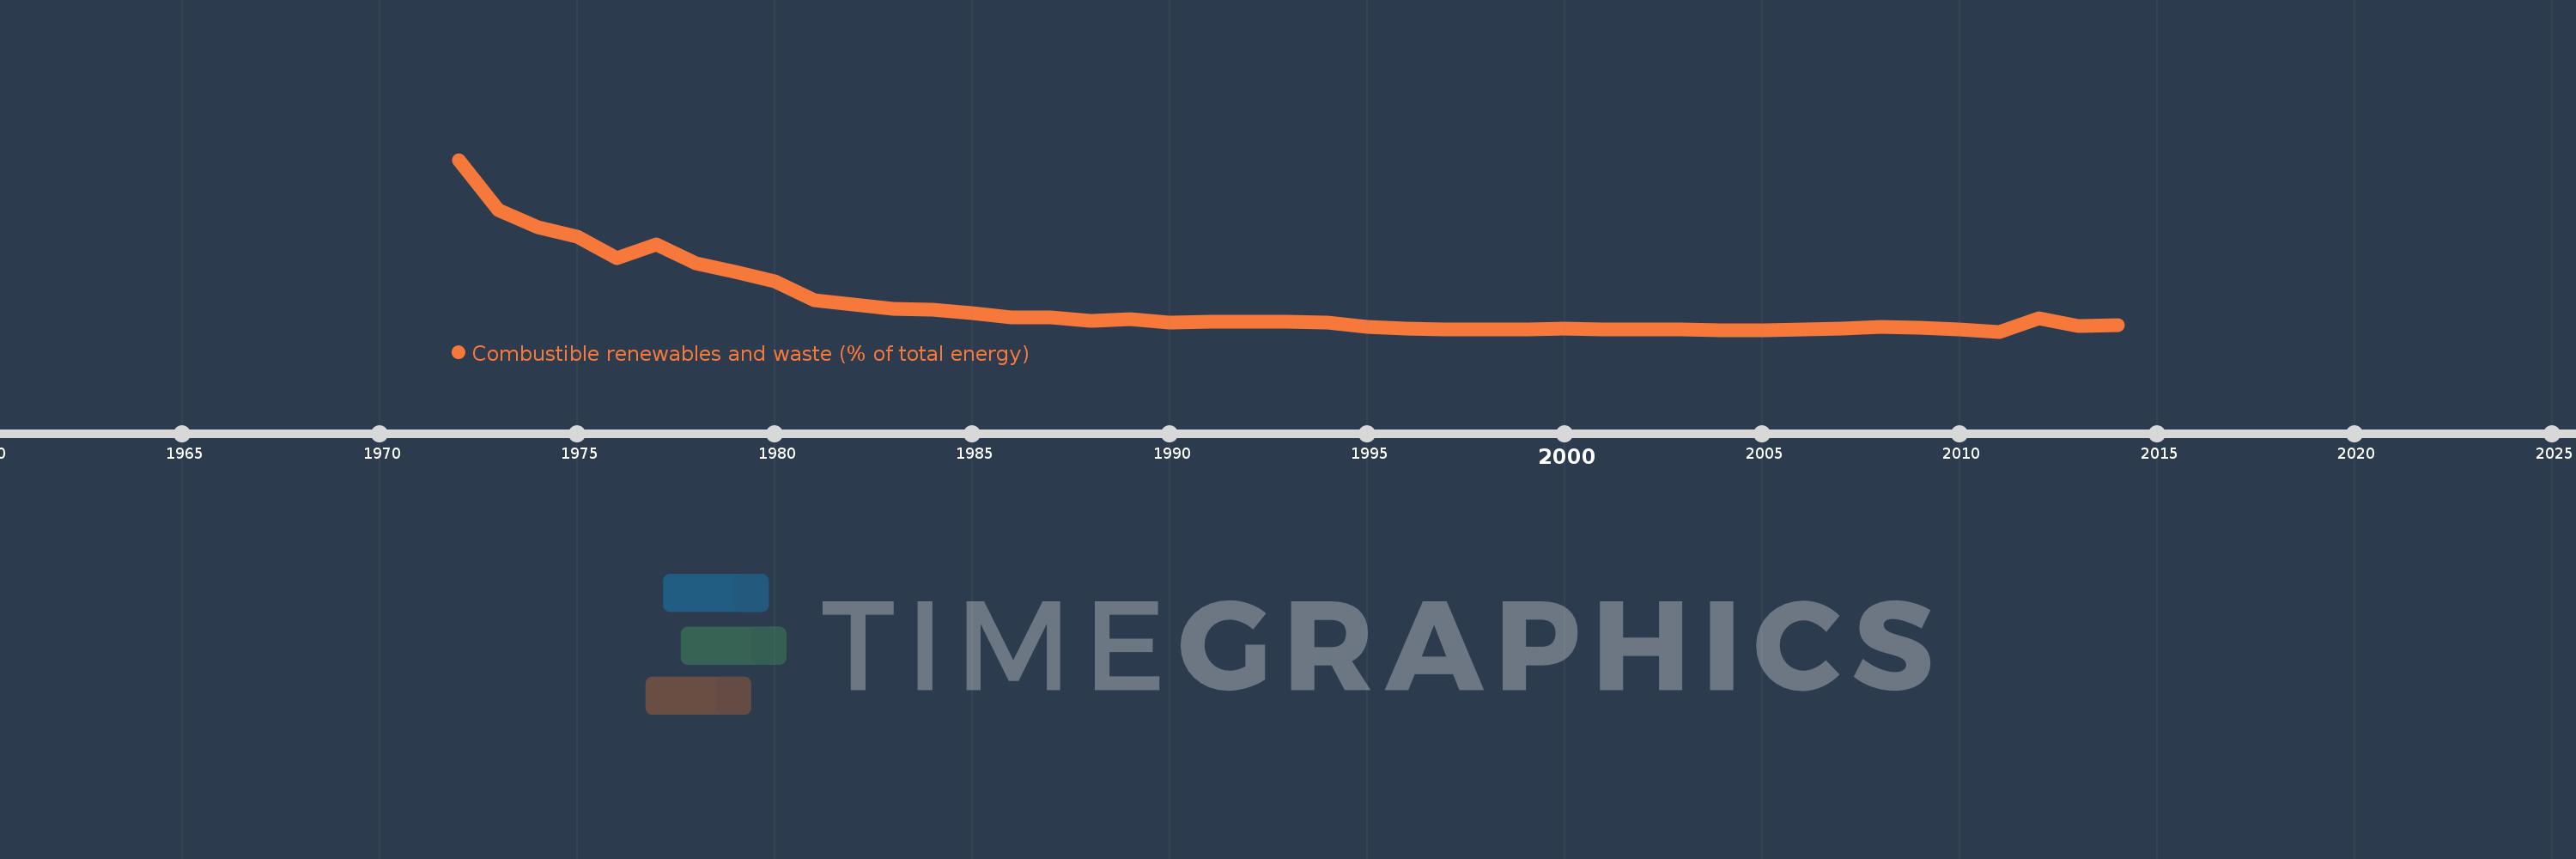
Combustible renewables and waste (% of total energy)
2014,2013,2012,2011,2010,2009,2008,2007,2006,2005,2004,2003,2002,2001,2000,1999,1998,1997,1996,1995,1994,1993,1992,1991,1990,1989,1988,1987,1986,1985,1984,1983,1982,1981,1980,1979,1978,1977,1976,1975,1974,1973,1972
Estas estadísticas en otros países:
AlbaniaAlgeriaAngolaArab WorldArgentinaArmeniaAustraliaAustriaAzerbaijanBahrainBangladeshBelarusBelgiumBeninBoliviaBosnia and HerzegovinaBotswanaBrazilBrunei DarussalamBulgariaCambodiaCameroonCanadaCaribbean small statesCentral Europe and the BalticsChileChinaColombiaCongo, Dem. Rep.Congo, Rep.Costa RicaCote d'IvoireCroatiaCubaCuracaoCyprusCzech RepublicDenmarkDominican RepublicEarly-demographic dividendEast Asia & PacificEast Asia & Pacific (excluding high income)East Asia & Pacific (IDA & IBRD countries)EcuadorEgypt, Arab Rep.El SalvadorEritreaEstoniaEthiopiaEuro areaEurope & Central AsiaEurope & Central Asia (excluding high income)Europe & Central Asia (IDA & IBRD countries)European UnionFinlandFragile and conflict affected situationsFranceGabonGeorgiaGermanyGhanaGibraltarGreeceGuatemalaHaitiHeavily indebted poor countries (HIPC)High incomeHondurasHong Kong SAR, ChinaHungaryIBRD onlyIcelandIDA & IBRD totalIDA blendIDA onlyIDA totalIndiaIndonesiaIran, Islamic Rep.IraqIrelandIsraelItalyJamaicaJapanJordanKazakhstanKenyaKorea, Dem. People’s Rep.Korea, Rep.KosovoKuwaitKyrgyz RepublicLate-demographic dividendLatin America & Caribbean Latin America & Caribbean (excluding high income)Latin America & the Caribbean (IDA & IBRD countries)LatviaLeast developed countries: UN classificationLebanonLibyaLithuaniaLow & middle incomeLow incomeLower middle incomeLuxembourgMacedonia, FYRMalaysiaMaltaMauritiusMexicoMiddle East & North AfricaMiddle East & North Africa (excluding high income)Middle East & North Africa (IDA & IBRD countries)Middle incomeMoldovaMongoliaMontenegroMoroccoMozambiqueMyanmarNamibiaNepalNetherlandsNew ZealandNicaraguaNigerNigeriaNorth AmericaNorwayOECD membersOmanOther small statesPakistanPanamaParaguayPeruPhilippinesPolandPortugalPost-demographic dividendPre-demographic dividendQatarRomaniaRussian FederationSaudi ArabiaSenegalSerbiaSingaporeSlovak RepublicSloveniaSmall statesSouth AfricaSouth AsiaSouth Asia (IDA & IBRD)South SudanSpainSri LankaSub-Saharan Africa Sub-Saharan Africa (excluding high income)Sub-Saharan Africa (IDA & IBRD countries)SudanSwedenSwitzerlandSyrian Arab RepublicTajikistanTanzaniaThailandTogoTrinidad and TobagoTunisiaTurkeyTurkmenistanUkraineUnited Arab EmiratesUnited KingdomUnited StatesUpper middle incomeUruguayUzbekistanVenezuela, RBVietnamWorldYemen, Rep.ZambiaZimbabwe línea de tiempo (timeline):
En esta escala de tiempo se presenta un gráfico de 1972 y 2014 de Libya. Los datos de 1971 están ausentes. El número de observaciones reales por fecha: 43.
Fuente (nombre):
Indicadores del desarrollo mundial
Fuente (organización):
IEA Statistics © OECD/IEA 2014 (http://www.iea.org/stats/index.asp), subject to https://www.iea.org/t&c/termsandconditions/
Categorías:
Energy & Mining
Se ha actualizado:
23 abr 2017 año
Los indicadores de los cambios de valor en los últimos años
Mínimo:
0.798
1 ene 2011 año
Máximo:
6.179
1 ene 1972 año
A la fecha de observación
Valor
Cambio absoluto
El cambio con respecto al valor anterior
1 ene 1972 año
6.179
+6.179
0.0%
1 ene 1973 año
4.606
-1.573
-25.46%
1 ene 1974 año
4.058
-0.548
-11.9%
1 ene 1975 año
3.783
-0.275
-6.77%
1 ene 1976 año
3.106
-0.677
-17.9%
1 ene 1977 año
3.536
+0.43
13.85%
1 ene 1978 año
2.935
-0.602
-17.02%
1 ene 1979 año
2.669
-0.266
-9.05%
1 ene 1980 año
2.381
-0.288
-10.78%
1 ene 1981 año
1.774
-0.607
-25.51%
1 ene 1982 año
1.642
-0.131
-7.41%
1 ene 1983 año
1.511
-0.131
-7.98%
1 ene 1984 año
1.48
-0.031
-2.07%
1 ene 1985 año
1.379
-0.101
-6.83%
1 ene 1986 año
1.234
-0.145
-10.52%
1 ene 1987 año
1.24
+0.006
0.47%
1 ene 1988 año
1.136
-0.104
-8.39%
1 ene 1989 año
1.182
+0.046
4.03%
1 ene 1990 año
1.088
-0.093
-7.9%
1 ene 1991 año
1.12
+0.031
2.88%
1 ene 1992 año
1.104
-0.016
-1.43%
1 ene 1993 año
1.109
+0.006
0.51%
1 ene 1994 año
1.069
-0.041
-3.65%
1 ene 1995 año
0.946
-0.122
-11.44%
1 ene 1996 año
0.894
-0.053
-5.55%
1 ene 1997 año
0.858
-0.036
-4.03%
1 ene 1998 año
0.862
+0.004
0.5%
1 ene 1999 año
0.87
+0.008
0.9%
1 ene 2000 año
0.901
+0.031
3.51%
1 ene 2001 año
0.878
-0.023
-2.55%
1 ene 2002 año
0.872
-0.005
-0.58%
1 ene 2003 año
0.855
-0.017
-1.99%
1 ene 2004 año
0.844
-0.011
-1.3%
1 ene 2005 año
0.834
-0.01
-1.21%
1 ene 2006 año
0.852
+0.018
2.21%
1 ene 2007 año
0.88
+0.028
3.3%
1 ene 2008 año
0.957
+0.076
8.69%
1 ene 2009 año
0.907
-0.049
-5.16%
1 ene 2010 año
0.852
-0.055
-6.06%
1 ene 2011 año
0.798
-0.055
-6.43%
1 ene 2012 año
1.221
+0.423
53.07%
1 ene 2013 año
0.974
-0.247
-20.19%
1 ene 2014 año
0.991
+0.017
1.69%
Ranking de los países por los datos estadísticos actuales


Comentarios: