29
/es/
es
AIzaSyAYiBZKx7MnpbEhh9jyipgxe19OcubqV5w
April 1, 2024
72791
Australia
AUS
true
2
1
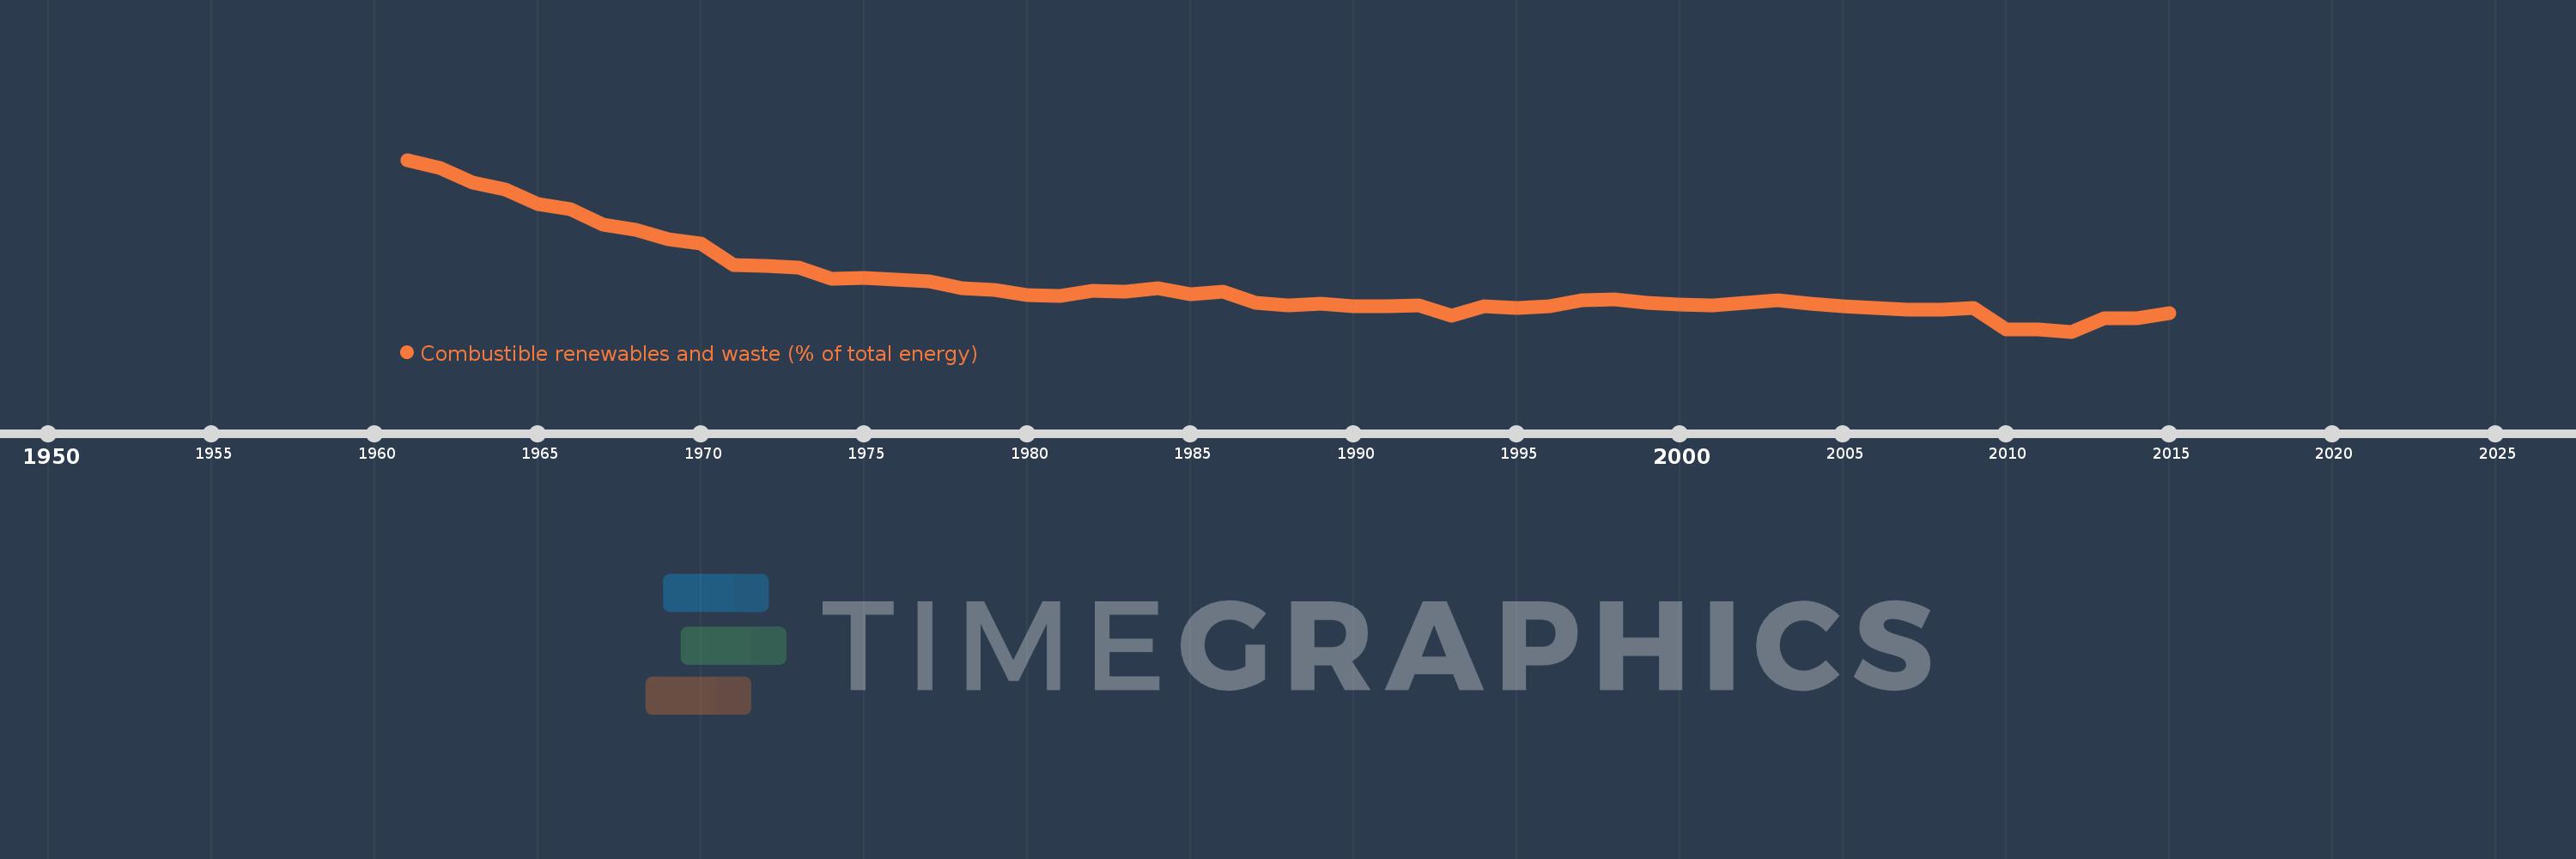
Combustible renewables and waste (% of total energy)
2015,2014,2013,2012,2011,2010,2009,2008,2007,2006,2005,2004,2003,2002,2001,2000,1999,1998,1997,1996,1995,1994,1993,1992,1991,1990,1989,1988,1987,1986,1985,1984,1983,1982,1981,1980,1979,1978,1977,1976,1975,1974,1973,1972,1971,1970,1969,1968,1967,1966,1965,1964,1963,1962,1961
Estas estadísticas en otros países:
AlbaniaAlgeriaAngolaArab WorldArgentinaArmeniaAustraliaAustriaAzerbaijanBahrainBangladeshBelarusBelgiumBeninBoliviaBosnia and HerzegovinaBotswanaBrazilBrunei DarussalamBulgariaCambodiaCameroonCanadaCaribbean small statesCentral Europe and the BalticsChileChinaColombiaCongo, Dem. Rep.Congo, Rep.Costa RicaCote d'IvoireCroatiaCubaCuracaoCyprusCzech RepublicDenmarkDominican RepublicEarly-demographic dividendEast Asia & PacificEast Asia & Pacific (excluding high income)East Asia & Pacific (IDA & IBRD countries)EcuadorEgypt, Arab Rep.El SalvadorEritreaEstoniaEthiopiaEuro areaEurope & Central AsiaEurope & Central Asia (excluding high income)Europe & Central Asia (IDA & IBRD countries)European UnionFinlandFragile and conflict affected situationsFranceGabonGeorgiaGermanyGhanaGibraltarGreeceGuatemalaHaitiHeavily indebted poor countries (HIPC)High incomeHondurasHong Kong SAR, ChinaHungaryIBRD onlyIcelandIDA & IBRD totalIDA blendIDA onlyIDA totalIndiaIndonesiaIran, Islamic Rep.IraqIrelandIsraelItalyJamaicaJapanJordanKazakhstanKenyaKorea, Dem. People’s Rep.Korea, Rep.KosovoKuwaitKyrgyz RepublicLate-demographic dividendLatin America & Caribbean Latin America & Caribbean (excluding high income)Latin America & the Caribbean (IDA & IBRD countries)LatviaLeast developed countries: UN classificationLebanonLibyaLithuaniaLow & middle incomeLow incomeLower middle incomeLuxembourgMacedonia, FYRMalaysiaMaltaMauritiusMexicoMiddle East & North AfricaMiddle East & North Africa (excluding high income)Middle East & North Africa (IDA & IBRD countries)Middle incomeMoldovaMongoliaMontenegroMoroccoMozambiqueMyanmarNamibiaNepalNetherlandsNew ZealandNicaraguaNigerNigeriaNorth AmericaNorwayOECD membersOmanOther small statesPakistanPanamaParaguayPeruPhilippinesPolandPortugalPost-demographic dividendPre-demographic dividendQatarRomaniaRussian FederationSaudi ArabiaSenegalSerbiaSingaporeSlovak RepublicSloveniaSmall statesSouth AfricaSouth AsiaSouth Asia (IDA & IBRD)South SudanSpainSri LankaSub-Saharan Africa Sub-Saharan Africa (excluding high income)Sub-Saharan Africa (IDA & IBRD countries)SudanSwedenSwitzerlandSyrian Arab RepublicTajikistanTanzaniaThailandTogoTrinidad and TobagoTunisiaTurkeyTurkmenistanUkraineUnited Arab EmiratesUnited KingdomUnited StatesUpper middle incomeUruguayUzbekistanVenezuela, RBVietnamWorldYemen, Rep.ZambiaZimbabwe línea de tiempo (timeline):
En esta escala de tiempo se presenta un gráfico de 1961 y 2015 de Australia. Los datos de 1960 están ausentes. El número de observaciones reales por fecha: 55.
Fuente (nombre):
Indicadores del desarrollo mundial
Fuente (organización):
IEA Statistics © OECD/IEA 2014 (http://www.iea.org/stats/index.asp), subject to https://www.iea.org/t&c/termsandconditions/
Categorías:
Energy & Mining
Se ha actualizado:
23 abr 2017 año
Los indicadores de los cambios de valor en los últimos años
Mínimo:
3.138
1 ene 2012 año
Máximo:
13.001
1 ene 1961 año
A la fecha de observación
Valor
Cambio absoluto
El cambio con respecto al valor anterior
1 ene 1961 año
13.001
+13.001
0.0%
1 ene 1962 año
12.531
-0.47
-3.61%
1 ene 1963 año
11.689
-0.842
-6.72%
1 ene 1964 año
11.294
-0.396
-3.39%
1 ene 1965 año
10.451
-0.842
-7.46%
1 ene 1966 año
10.15
-0.302
-2.89%
1 ene 1967 año
9.288
-0.862
-8.49%
1 ene 1968 año
8.995
-0.293
-3.16%
1 ene 1969 año
8.448
-0.547
-6.08%
1 ene 1970 año
8.182
-0.265
-3.14%
1 ene 1971 año
6.965
-1.218
-14.88%
1 ene 1972 año
6.893
-0.072
-1.04%
1 ene 1973 año
6.823
-0.07
-1.02%
1 ene 1974 año
6.182
-0.64
-9.39%
1 ene 1975 año
6.242
+0.06
0.97%
1 ene 1976 año
6.122
-0.12
-1.92%
1 ene 1977 año
6.01
-0.112
-1.84%
1 ene 1978 año
5.606
-0.404
-6.72%
1 ene 1979 año
5.535
-0.071
-1.26%
1 ene 1980 año
5.215
-0.32
-5.78%
1 ene 1981 año
5.19
-0.024
-0.47%
1 ene 1982 año
5.462
+0.271
5.23%
1 ene 1983 año
5.434
-0.028
-0.51%
1 ene 1984 año
5.607
+0.173
3.19%
1 ene 1985 año
5.296
-0.311
-5.55%
1 ene 1986 año
5.432
+0.136
2.56%
1 ene 1987 año
4.782
-0.65
-11.97%
1 ene 1988 año
4.65
-0.132
-2.76%
1 ene 1989 año
4.735
+0.085
1.84%
1 ene 1990 año
4.573
-0.163
-3.43%
1 ene 1991 año
4.586
+0.013
0.29%
1 ene 1992 año
4.619
+0.033
0.72%
1 ene 1993 año
4.043
-0.576
-12.46%
1 ene 1994 año
4.589
+0.545
13.49%
1 ene 1995 año
4.477
-0.112
-2.45%
1 ene 1996 año
4.607
+0.13
2.9%
1 ene 1997 año
4.927
+0.321
6.96%
1 ene 1998 año
5.004
+0.077
1.56%
1 ene 1999 año
4.768
-0.236
-4.71%
1 ene 2000 año
4.679
-0.089
-1.88%
1 ene 2001 año
4.658
-0.021
-0.45%
1 ene 2002 año
4.809
+0.152
3.26%
1 ene 2003 año
4.946
+0.137
2.85%
1 ene 2004 año
4.732
-0.215
-4.34%
1 ene 2005 año
4.588
-0.144
-3.05%
1 ene 2006 año
4.496
-0.092
-2.0%
1 ene 2007 año
4.379
-0.116
-2.59%
1 ene 2008 año
4.388
+0.009
0.21%
1 ene 2009 año
4.5
+0.111
2.54%
1 ene 2010 año
3.267
-1.233
-27.4%
1 ene 2011 año
3.28
+0.013
0.41%
1 ene 2012 año
3.138
-0.142
-4.33%
1 ene 2013 año
3.925
+0.787
25.08%
1 ene 2014 año
3.914
-0.011
-0.28%
1 ene 2015 año
4.197
+0.283
7.23%
Ranking de los países por los datos estadísticos actuales


Comentarios: