29
/es/
es
AIzaSyAYiBZKx7MnpbEhh9jyipgxe19OcubqV5w
April 1, 2024
84357
Benin
BEN
true
2
1
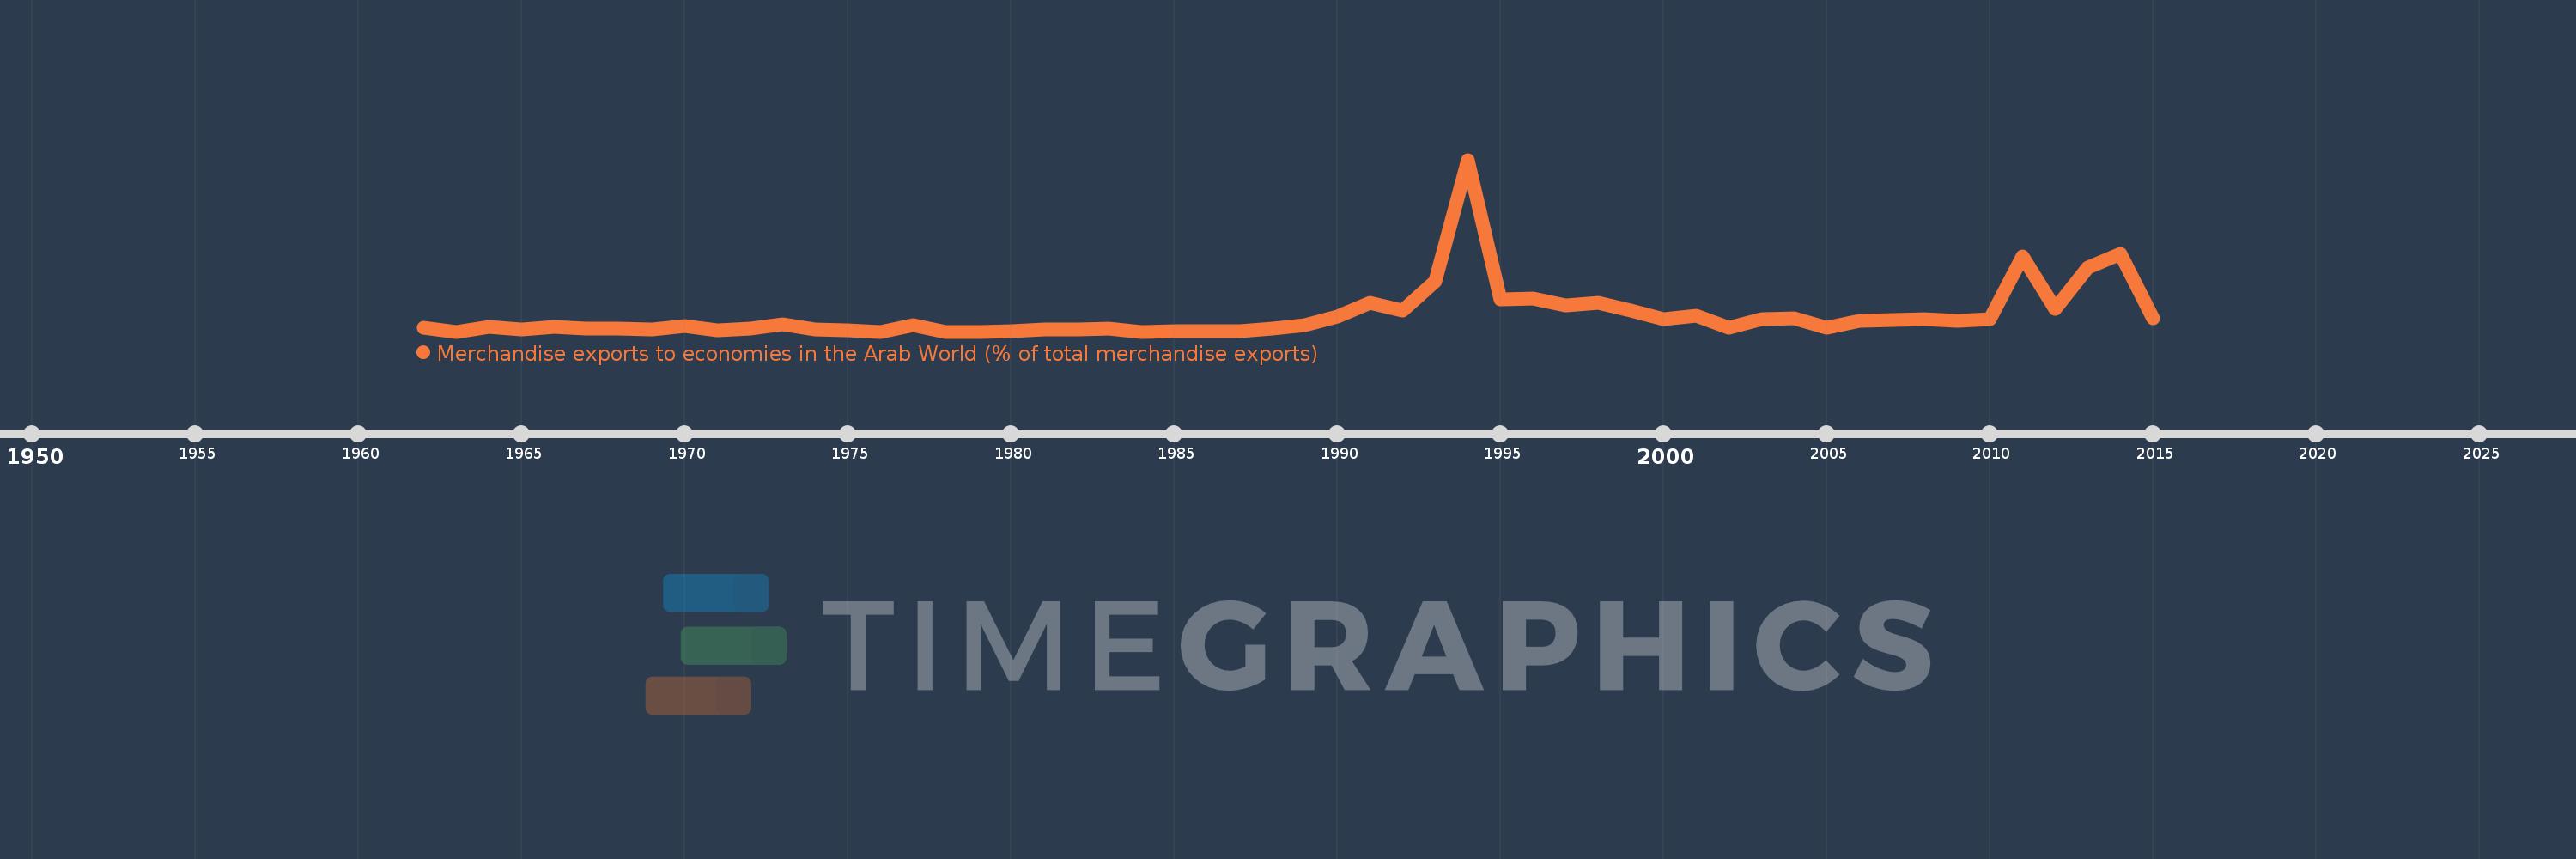
Merchandise exports to economies in the Arab World (% of total merchandise exports)
2015,2014,2013,2012,2011,2010,2009,2008,2007,2006,2005,2004,2003,2002,2001,2000,1999,1998,1997,1996,1995,1994,1993,1992,1991,1990,1989,1988,1987,1986,1985,1984,1983,1982,1981,1980,1979,1978,1977,1976,1975,1974,1973,1972,1971,1970,1969,1968,1967,1966,1965,1964,1963,1962
Estas estadísticas en otros países:
AfghanistanAlbaniaAlgeriaAngolaArab WorldArgentinaArmeniaArubaAustraliaAustriaAzerbaijanBahamas, TheBahrainBangladeshBarbadosBelarusBelgiumBelizeBeninBermudaBoliviaBosnia and HerzegovinaBrazilBrunei DarussalamBulgariaBurkina FasoBurundiCabo VerdeCambodiaCameroonCanadaCaribbean small statesCentral African RepublicCentral Europe and the BalticsChadChileChinaColombiaComorosCongo, Dem. Rep.Congo, Rep.Costa RicaCote d'IvoireCroatiaCubaCyprusCzech RepublicDenmarkDjiboutiDominicaDominican RepublicEarly-demographic dividendEast Asia & PacificEast Asia & Pacific (excluding high income)East Asia & Pacific (IDA & IBRD countries)EcuadorEgypt, Arab Rep.El SalvadorEstoniaEthiopiaEuro areaEurope & Central AsiaEurope & Central Asia (excluding high income)Europe & Central Asia (IDA & IBRD countries)European UnionFijiFinlandFragile and conflict affected situationsFranceGabonGambia, TheGeorgiaGermanyGhanaGreeceGreenlandGrenadaGuatemalaGuineaGuinea-BissauGuyanaHaitiHeavily indebted poor countries (HIPC)High incomeHondurasHong Kong SAR, ChinaHungaryIBRD onlyIcelandIDA & IBRD totalIDA blendIDA onlyIDA totalIndiaIndonesiaIran, Islamic Rep.IraqIrelandIsraelItalyJamaicaJapanJordanKazakhstanKenyaKorea, Dem. People’s Rep.Korea, Rep.KosovoKuwaitKyrgyz RepublicLao PDRLate-demographic dividendLatin America & Caribbean Latin America & Caribbean (excluding high income)Latin America & the Caribbean (IDA & IBRD countries)LatviaLeast developed countries: UN classificationLebanonLiberiaLibyaLithuaniaLow & middle incomeLow incomeLower middle incomeLuxembourgMacao SAR, ChinaMacedonia, FYRMadagascarMalawiMalaysiaMaldivesMaliMaltaMauritaniaMauritiusMexicoMiddle East & North AfricaMiddle East & North Africa (excluding high income)Middle East & North Africa (IDA & IBRD countries)Middle incomeMoldovaMongoliaMontenegroMoroccoMozambiqueMyanmarNepalNetherlandsNew CaledoniaNew ZealandNicaraguaNigerNigeriaNorth AmericaNorwayOECD membersOmanOther small statesPacific island small statesPakistanPanamaPapua New GuineaParaguayPeruPhilippinesPolandPortugalPost-demographic dividendPre-demographic dividendQatarRomaniaRussian FederationRwandaSamoaSaudi ArabiaSenegalSerbiaSeychellesSierra LeoneSingaporeSlovak RepublicSloveniaSmall statesSomaliaSouth AfricaSouth AsiaSouth Asia (IDA & IBRD)SpainSri LankaSt. LuciaSt. Vincent and the GrenadinesSub-Saharan Africa Sub-Saharan Africa (excluding high income)Sub-Saharan Africa (IDA & IBRD countries)SudanSurinameSwedenSwitzerlandSyrian Arab RepublicTajikistanTanzaniaThailandTogoTrinidad and TobagoTunisiaTurkeyTurkmenistanUgandaUkraineUnited Arab EmiratesUnited KingdomUnited StatesUpper middle incomeUruguayUzbekistanVenezuela, RBVietnamWorldYemen, Rep.ZambiaZimbabwe línea de tiempo (timeline):
En esta escala de tiempo se presenta un gráfico de 1962 y 2015 de Benin. Los datos de 1961 están ausentes. El número de observaciones reales por fecha: 54.
Fuente (nombre):
Indicadores del desarrollo mundial
Fuente (organización):
World Bank staff estimates based data from International Monetary Fund's Direction of Trade database.
Categorías:
Private Sector, Trade
Se ha actualizado:
23 abr 2017 año
Los indicadores de los cambios de valor en los últimos años
Máximo:
55.827
1 ene 1994 año
A la fecha de observación
Valor
Cambio absoluto
El cambio con respecto al valor anterior
1 ene 1962 año
1.307
+1.307
0.0%
1 ene 1963 año
0.0
-1.307
-100.0%
1 ene 1964 año
1.613
+1.613
%
1 ene 1965 año
0.763
-0.85
-52.67%
1 ene 1966 año
1.46
+0.696
91.24%
1 ene 1967 año
0.983
-0.477
-32.66%
1 ene 1968 año
1.058
+0.075
7.61%
1 ene 1969 año
0.625
-0.433
-40.92%
1 ene 1970 año
1.719
+1.094
175.14%
1 ene 1971 año
0.282
-1.437
-83.6%
1 ene 1972 año
1.025
+0.743
263.45%
1 ene 1973 año
2.303
+1.278
124.68%
1 ene 1974 año
0.773
-1.53
-66.43%
1 ene 1975 año
0.361
-0.412
-53.24%
1 ene 1976 año
0.0
-0.361
-100.0%
1 ene 1977 año
2.046
+2.046
%
1 ene 1978 año
0.0
-2.046
-100.0%
1 ene 1980 año
0.004
+0.004
%
1 ene 1981 año
0.562
+0.558
12.81 mil%
1 ene 1982 año
0.735
+0.173
30.83%
1 ene 1983 año
0.853
+0.117
15.97%
1 ene 1984 año
0.0
-0.853
-100.0%
1 ene 1985 año
0.089
+0.089
%
1 ene 1986 año
0.043
-0.047
-52.22%
1 ene 1987 año
0.067
+0.024
55.86%
1 ene 1988 año
0.873
+0.807
1.21 mil%
1 ene 1989 año
2.193
+1.32
151.16%
1 ene 1990 año
4.752
+2.559
116.68%
1 ene 1991 año
9.381
+4.629
97.42%
1 ene 1992 año
6.822
-2.559
-27.28%
1 ene 1993 año
16.456
+9.635
141.24%
1 ene 1994 año
55.827
+39.371
239.24%
1 ene 1995 año
10.487
-45.34
-81.22%
1 ene 1996 año
10.66
+0.174
1.65%
1 ene 1997 año
8.489
-2.171
-20.37%
1 ene 1998 año
9.249
+0.76
8.96%
1 ene 1999 año
6.937
-2.313
-25.0%
1 ene 2000 año
3.972
-2.964
-42.73%
1 ene 2001 año
5.154
+1.182
29.75%
1 ene 2002 año
1.296
-3.858
-74.86%
1 ene 2003 año
4.01
+2.714
209.45%
1 ene 2004 año
4.334
+0.324
8.08%
1 ene 2005 año
1.343
-2.991
-69.0%
1 ene 2006 año
3.512
+2.168
161.42%
1 ene 2007 año
3.744
+0.232
6.61%
1 ene 2008 año
4.169
+0.425
11.35%
1 ene 2009 año
3.357
-0.811
-19.46%
1 ene 2010 año
4.085
+0.727
21.66%
1 ene 2011 año
24.369
+20.284
496.59%
1 ene 2012 año
7.403
-16.966
-69.62%
1 ene 2013 año
20.883
+13.48
182.09%
1 ene 2014 año
25.28
+4.396
21.05%
1 ene 2015 año
4.269
-21.011
-83.11%
Ranking de los países por los datos estadísticos actuales


Comentarios: