29
/es/
es
AIzaSyAYiBZKx7MnpbEhh9jyipgxe19OcubqV5w
April 1, 2024
139516
Germany
DEU
true
2
1
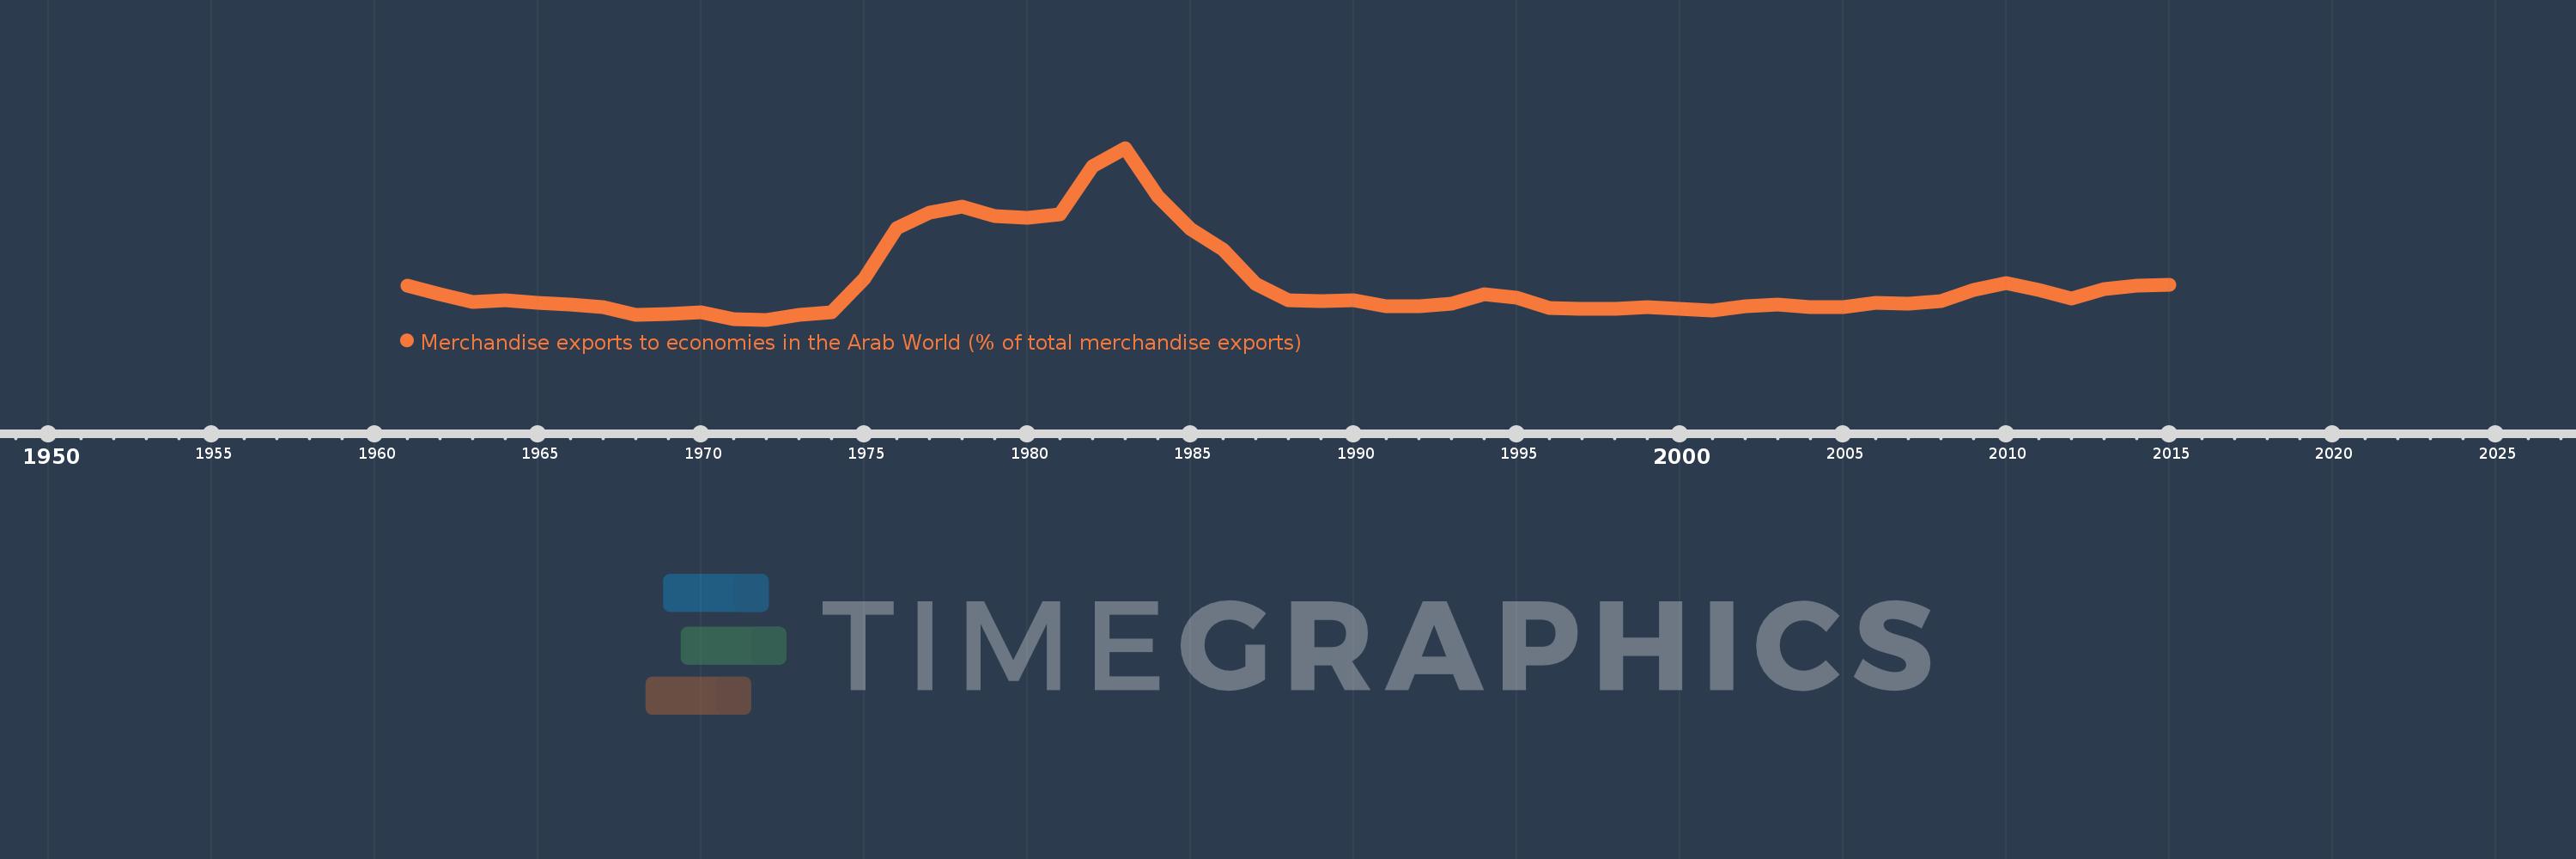
Merchandise exports to economies in the Arab World (% of total merchandise exports)
2015,2014,2013,2012,2011,2010,2009,2008,2007,2006,2005,2004,2003,2002,2001,2000,1999,1998,1997,1996,1995,1994,1993,1992,1991,1990,1989,1988,1987,1986,1985,1984,1983,1982,1981,1980,1979,1978,1977,1976,1975,1974,1973,1972,1971,1970,1969,1968,1967,1966,1965,1964,1963,1962,1961
Estas estadísticas en otros países:
AfghanistanAlbaniaAlgeriaAngolaArab WorldArgentinaArmeniaArubaAustraliaAustriaAzerbaijanBahamas, TheBahrainBangladeshBarbadosBelarusBelgiumBelizeBeninBermudaBoliviaBosnia and HerzegovinaBrazilBrunei DarussalamBulgariaBurkina FasoBurundiCabo VerdeCambodiaCameroonCanadaCaribbean small statesCentral African RepublicCentral Europe and the BalticsChadChileChinaColombiaComorosCongo, Dem. Rep.Congo, Rep.Costa RicaCote d'IvoireCroatiaCubaCyprusCzech RepublicDenmarkDjiboutiDominicaDominican RepublicEarly-demographic dividendEast Asia & PacificEast Asia & Pacific (excluding high income)East Asia & Pacific (IDA & IBRD countries)EcuadorEgypt, Arab Rep.El SalvadorEstoniaEthiopiaEuro areaEurope & Central AsiaEurope & Central Asia (excluding high income)Europe & Central Asia (IDA & IBRD countries)European UnionFijiFinlandFragile and conflict affected situationsFranceGabonGambia, TheGeorgiaGermanyGhanaGreeceGreenlandGrenadaGuatemalaGuineaGuinea-BissauGuyanaHaitiHeavily indebted poor countries (HIPC)High incomeHondurasHong Kong SAR, ChinaHungaryIBRD onlyIcelandIDA & IBRD totalIDA blendIDA onlyIDA totalIndiaIndonesiaIran, Islamic Rep.IraqIrelandIsraelItalyJamaicaJapanJordanKazakhstanKenyaKorea, Dem. People’s Rep.Korea, Rep.KosovoKuwaitKyrgyz RepublicLao PDRLate-demographic dividendLatin America & Caribbean Latin America & Caribbean (excluding high income)Latin America & the Caribbean (IDA & IBRD countries)LatviaLeast developed countries: UN classificationLebanonLiberiaLibyaLithuaniaLow & middle incomeLow incomeLower middle incomeLuxembourgMacao SAR, ChinaMacedonia, FYRMadagascarMalawiMalaysiaMaldivesMaliMaltaMauritaniaMauritiusMexicoMiddle East & North AfricaMiddle East & North Africa (excluding high income)Middle East & North Africa (IDA & IBRD countries)Middle incomeMoldovaMongoliaMontenegroMoroccoMozambiqueMyanmarNepalNetherlandsNew CaledoniaNew ZealandNicaraguaNigerNigeriaNorth AmericaNorwayOECD membersOmanOther small statesPacific island small statesPakistanPanamaPapua New GuineaParaguayPeruPhilippinesPolandPortugalPost-demographic dividendPre-demographic dividendQatarRomaniaRussian FederationRwandaSamoaSaudi ArabiaSenegalSerbiaSeychellesSierra LeoneSingaporeSlovak RepublicSloveniaSmall statesSomaliaSouth AfricaSouth AsiaSouth Asia (IDA & IBRD)SpainSri LankaSt. LuciaSt. Vincent and the GrenadinesSub-Saharan Africa Sub-Saharan Africa (excluding high income)Sub-Saharan Africa (IDA & IBRD countries)SudanSurinameSwedenSwitzerlandSyrian Arab RepublicTajikistanTanzaniaThailandTogoTrinidad and TobagoTunisiaTurkeyTurkmenistanUgandaUkraineUnited Arab EmiratesUnited KingdomUnited StatesUpper middle incomeUruguayUzbekistanVenezuela, RBVietnamWorldYemen, Rep.ZambiaZimbabwe línea de tiempo (timeline):
En esta escala de tiempo se presenta un gráfico de 1961 y 2015 de Germany. Los datos de 1960 están ausentes. El número de observaciones reales por fecha: 55.
Fuente (nombre):
Indicadores del desarrollo mundial
Fuente (organización):
World Bank staff estimates based data from International Monetary Fund's Direction of Trade database.
Categorías:
Private Sector, Trade
Se ha actualizado:
23 abr 2017 año
Los indicadores de los cambios de valor en los últimos años
Mínimo:
1.74
1 ene 1972 año
Máximo:
7.987
1 ene 1983 año
A la fecha de observación
Valor
Cambio absoluto
El cambio con respecto al valor anterior
1 ene 1961 año
2.97
+2.97
0.0%
1 ene 1962 año
2.664
-0.306
-10.3%
1 ene 1963 año
2.388
-0.276
-10.38%
1 ene 1964 año
2.441
+0.053
2.22%
1 ene 1965 año
2.362
-0.079
-3.24%
1 ene 1966 año
2.285
-0.077
-3.25%
1 ene 1967 año
2.184
-0.101
-4.41%
1 ene 1968 año
1.931
-0.253
-11.59%
1 ene 1969 año
1.953
+0.022
1.15%
1 ene 1970 año
2.023
+0.07
3.59%
1 ene 1971 año
1.765
-0.259
-12.78%
1 ene 1972 año
1.74
-0.025
-1.39%
1 ene 1973 año
1.924
+0.184
10.56%
1 ene 1974 año
2.019
+0.095
4.96%
1 ene 1975 año
3.216
+1.197
59.27%
1 ene 1976 año
5.086
+1.87
58.13%
1 ene 1977 año
5.649
+0.563
11.07%
1 ene 1978 año
5.851
+0.203
3.59%
1 ene 1979 año
5.515
-0.337
-5.75%
1 ene 1980 año
5.46
-0.055
-1.0%
1 ene 1981 año
5.56
+0.1
1.84%
1 ene 1982 año
7.313
+1.753
31.52%
1 ene 1983 año
7.987
+0.674
9.22%
1 ene 1984 año
6.226
-1.761
-22.05%
1 ene 1985 año
5.026
-1.201
-19.28%
1 ene 1986 año
4.281
-0.745
-14.82%
1 ene 1987 año
3.04
-1.241
-28.99%
1 ene 1988 año
2.459
-0.581
-19.11%
1 ene 1989 año
2.406
-0.053
-2.14%
1 ene 1990 año
2.445
+0.038
1.59%
1 ene 1991 año
2.239
-0.206
-8.41%
1 ene 1992 año
2.232
-0.007
-0.32%
1 ene 1993 año
2.331
+0.099
4.45%
1 ene 1994 año
2.663
+0.332
14.23%
1 ene 1995 año
2.535
-0.127
-4.79%
1 ene 1996 año
2.162
-0.373
-14.72%
1 ene 1997 año
2.125
-0.037
-1.73%
1 ene 1998 año
2.122
-0.002
-0.12%
1 ene 1999 año
2.204
+0.082
3.85%
1 ene 2000 año
2.149
-0.055
-2.51%
1 ene 2001 año
2.08
-0.069
-3.21%
1 ene 2002 año
2.22
+0.14
6.75%
1 ene 2003 año
2.292
+0.072
3.26%
1 ene 2004 año
2.207
-0.085
-3.72%
1 ene 2005 año
2.198
-0.009
-0.41%
1 ene 2006 año
2.359
+0.161
7.33%
1 ene 2007 año
2.338
-0.021
-0.89%
1 ene 2008 año
2.424
+0.087
3.71%
1 ene 2009 año
2.838
+0.413
17.04%
1 ene 2010 año
3.067
+0.229
8.08%
1 ene 2011 año
2.835
-0.232
-7.56%
1 ene 2012 año
2.503
-0.332
-11.72%
1 ene 2013 año
2.854
+0.352
14.05%
1 ene 2014 año
2.981
+0.126
4.42%
1 ene 2015 año
3.026
+0.046
1.54%
Ranking de los países por los datos estadísticos actuales


Comentarios: