29
/es/
es
AIzaSyAYiBZKx7MnpbEhh9jyipgxe19OcubqV5w
April 1, 2024
116007
Cuba
CUB
true
2
1
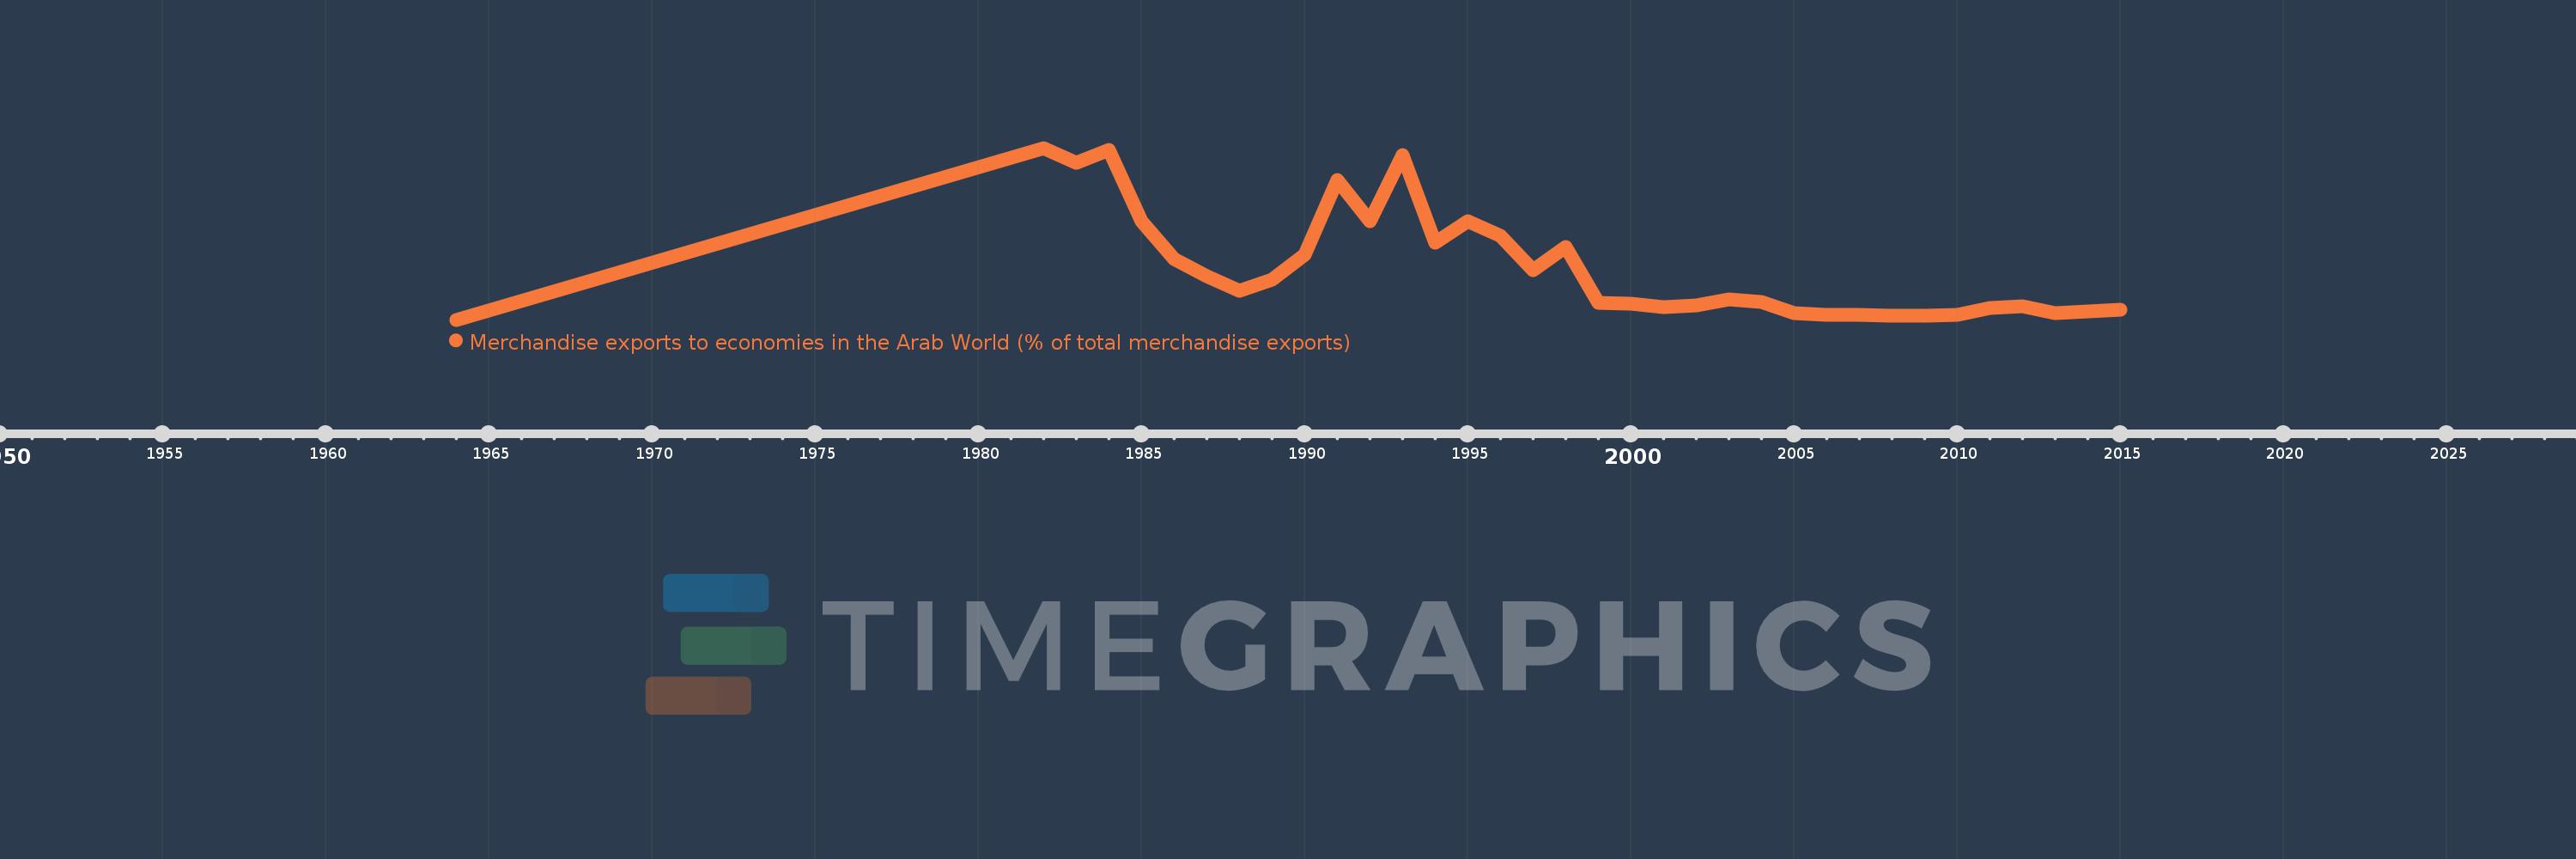
Merchandise exports to economies in the Arab World (% of total merchandise exports)
2015,2014,2013,2012,2011,2010,2009,2008,2007,2006,2005,2004,2003,2002,2001,2000,1999,1998,1997,1996,1995,1994,1993,1992,1991,1990,1989,1988,1987,1986,1985,1984,1983,1982,1964
Estas estadísticas en otros países:
AfghanistanAlbaniaAlgeriaAngolaArab WorldArgentinaArmeniaArubaAustraliaAustriaAzerbaijanBahamas, TheBahrainBangladeshBarbadosBelarusBelgiumBelizeBeninBermudaBoliviaBosnia and HerzegovinaBrazilBrunei DarussalamBulgariaBurkina FasoBurundiCabo VerdeCambodiaCameroonCanadaCaribbean small statesCentral African RepublicCentral Europe and the BalticsChadChileChinaColombiaComorosCongo, Dem. Rep.Congo, Rep.Costa RicaCote d'IvoireCroatiaCubaCyprusCzech RepublicDenmarkDjiboutiDominicaDominican RepublicEarly-demographic dividendEast Asia & PacificEast Asia & Pacific (excluding high income)East Asia & Pacific (IDA & IBRD countries)EcuadorEgypt, Arab Rep.El SalvadorEstoniaEthiopiaEuro areaEurope & Central AsiaEurope & Central Asia (excluding high income)Europe & Central Asia (IDA & IBRD countries)European UnionFijiFinlandFragile and conflict affected situationsFranceGabonGambia, TheGeorgiaGermanyGhanaGreeceGreenlandGrenadaGuatemalaGuineaGuinea-BissauGuyanaHaitiHeavily indebted poor countries (HIPC)High incomeHondurasHong Kong SAR, ChinaHungaryIBRD onlyIcelandIDA & IBRD totalIDA blendIDA onlyIDA totalIndiaIndonesiaIran, Islamic Rep.IraqIrelandIsraelItalyJamaicaJapanJordanKazakhstanKenyaKorea, Dem. People’s Rep.Korea, Rep.KosovoKuwaitKyrgyz RepublicLao PDRLate-demographic dividendLatin America & Caribbean Latin America & Caribbean (excluding high income)Latin America & the Caribbean (IDA & IBRD countries)LatviaLeast developed countries: UN classificationLebanonLiberiaLibyaLithuaniaLow & middle incomeLow incomeLower middle incomeLuxembourgMacao SAR, ChinaMacedonia, FYRMadagascarMalawiMalaysiaMaldivesMaliMaltaMauritaniaMauritiusMexicoMiddle East & North AfricaMiddle East & North Africa (excluding high income)Middle East & North Africa (IDA & IBRD countries)Middle incomeMoldovaMongoliaMontenegroMoroccoMozambiqueMyanmarNepalNetherlandsNew CaledoniaNew ZealandNicaraguaNigerNigeriaNorth AmericaNorwayOECD membersOmanOther small statesPacific island small statesPakistanPanamaPapua New GuineaParaguayPeruPhilippinesPolandPortugalPost-demographic dividendPre-demographic dividendQatarRomaniaRussian FederationRwandaSamoaSaudi ArabiaSenegalSerbiaSeychellesSierra LeoneSingaporeSlovak RepublicSloveniaSmall statesSomaliaSouth AfricaSouth AsiaSouth Asia (IDA & IBRD)SpainSri LankaSt. LuciaSt. Vincent and the GrenadinesSub-Saharan Africa Sub-Saharan Africa (excluding high income)Sub-Saharan Africa (IDA & IBRD countries)SudanSurinameSwedenSwitzerlandSyrian Arab RepublicTajikistanTanzaniaThailandTogoTrinidad and TobagoTunisiaTurkeyTurkmenistanUgandaUkraineUnited Arab EmiratesUnited KingdomUnited StatesUpper middle incomeUruguayUzbekistanVenezuela, RBVietnamWorldYemen, Rep.ZambiaZimbabwe línea de tiempo (timeline):
En esta escala de tiempo se presenta un gráfico de 1964 y 2015 de Cuba. Los datos de 1963 están ausentes. El número de observaciones reales por fecha: 35.
Fuente (nombre):
Indicadores del desarrollo mundial
Fuente (organización):
World Bank staff estimates based data from International Monetary Fund's Direction of Trade database.
Categorías:
Private Sector, Trade
Se ha actualizado:
23 abr 2017 año
Los indicadores de los cambios de valor en los últimos años
Máximo:
19.094
1 ene 1982 año
A la fecha de observación
Valor
Cambio absoluto
El cambio con respecto al valor anterior
1 ene 1964 año
0.0
0.0
0.0%
1 ene 1982 año
19.094
+19.094
%
1 ene 1983 año
17.404
-1.69
-8.85%
1 ene 1984 año
18.915
+1.511
8.68%
1 ene 1985 año
10.987
-7.928
-41.91%
1 ene 1986 año
6.738
-4.249
-38.67%
1 ene 1987 año
4.848
-1.891
-28.06%
1 ene 1988 año
3.206
-1.642
-33.86%
1 ene 1989 año
4.462
+1.256
39.16%
1 ene 1990 año
7.268
+2.806
62.89%
1 ene 1991 año
15.521
+8.254
113.57%
1 ene 1992 año
10.988
-4.534
-29.21%
1 ene 1993 año
18.291
+7.304
66.47%
1 ene 1994 año
8.568
-9.724
-53.16%
1 ene 1995 año
10.985
+2.418
28.22%
1 ene 1996 año
9.297
-1.689
-15.37%
1 ene 1997 año
5.551
-3.746
-40.29%
1 ene 1998 año
8.048
+2.497
44.98%
1 ene 1999 año
1.896
-6.152
-76.44%
1 ene 2000 año
1.811
-0.085
-4.49%
1 ene 2001 año
1.371
-0.44
-24.32%
1 ene 2002 año
1.64
+0.269
19.65%
1 ene 2003 año
2.233
+0.593
36.13%
1 ene 2004 año
2.008
-0.225
-10.07%
1 ene 2005 año
0.734
-1.274
-63.44%
1 ene 2006 año
0.539
-0.195
-26.59%
1 ene 2007 año
0.525
-0.014
-2.65%
1 ene 2008 año
0.479
-0.045
-8.62%
1 ene 2009 año
0.444
-0.035
-7.31%
1 ene 2010 año
0.559
+0.114
25.73%
1 ene 2011 año
1.347
+0.788
141.12%
1 ene 2012 año
1.5
+0.153
11.34%
1 ene 2013 año
0.716
-0.784
-52.26%
1 ene 2014 año
0.931
+0.215
29.96%
1 ene 2015 año
1.16
+0.229
24.61%
Ranking de los países por los datos estadísticos actuales


Comentarios: