29
/es/
es
AIzaSyAYiBZKx7MnpbEhh9jyipgxe19OcubqV5w
April 1, 2024
84147
Benin
BEN
true
2
1
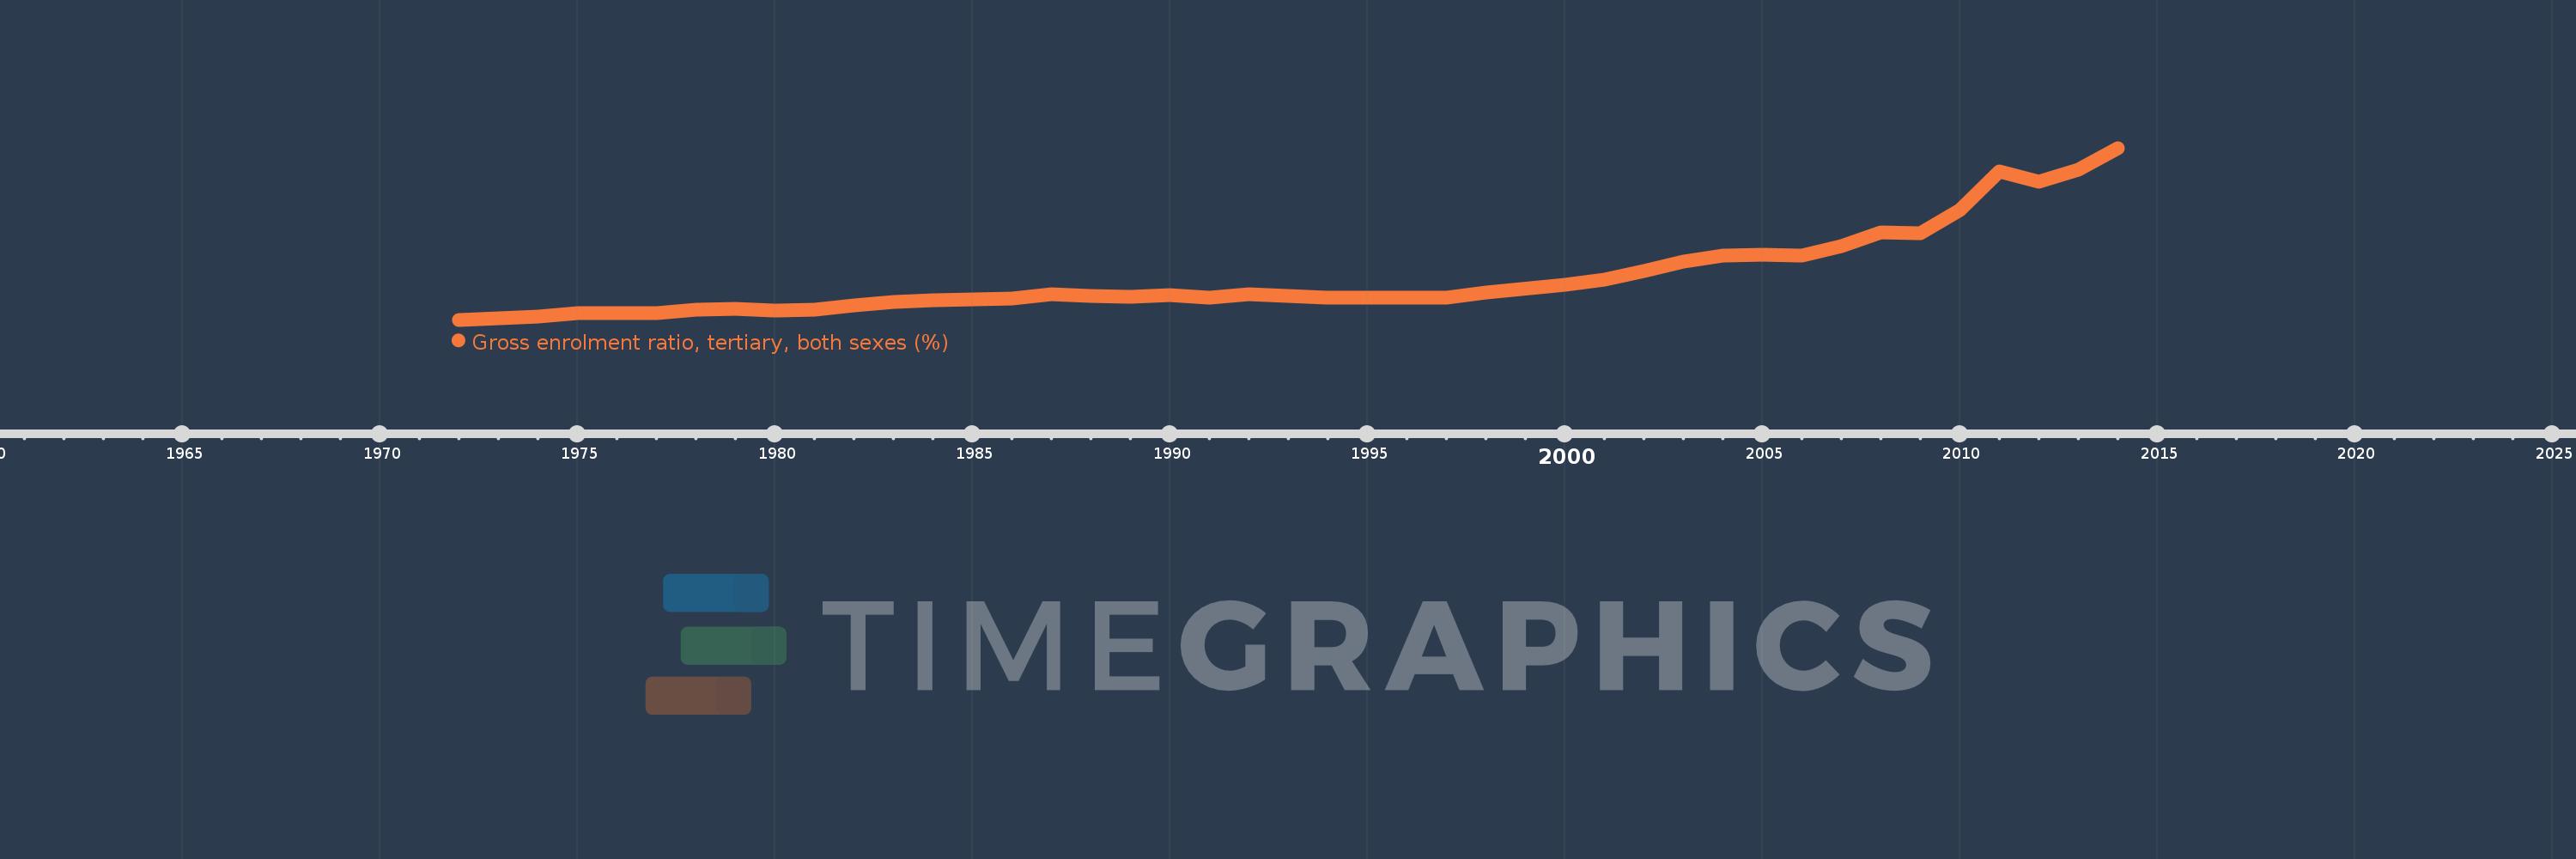
Gross enrolment ratio, tertiary, both sexes (%)
2014,2013,2012,2011,2010,2009,2008,2007,2006,2005,2004,2003,2002,2001,2000,1998,1997,1996,1995,1994,1993,1992,1991,1990,1989,1988,1987,1986,1985,1984,1983,1982,1981,1980,1979,1978,1977,1976,1975,1974,1973,1972
Estas estadísticas en otros países:
AfghanistanAlbaniaAlgeriaAngolaAntigua and BarbudaArab WorldArgentinaArmeniaArubaAustraliaAustriaAzerbaijanBahamas, TheBahrainBangladeshBarbadosBelarusBelgiumBelizeBeninBermudaBhutanBoliviaBosnia and HerzegovinaBotswanaBrazilBritish Virgin IslandsBrunei DarussalamBulgariaBurkina FasoBurundiCabo VerdeCambodiaCameroonCanadaCaribbean small statesCentral African RepublicCentral Europe and the BalticsChadChileChinaColombiaComorosCongo, Dem. Rep.Congo, Rep.Costa RicaCote d'IvoireCroatiaCubaCuracaoCyprusCzech RepublicDenmarkDjiboutiDominicaDominican RepublicEarly-demographic dividendEast Asia & PacificEast Asia & Pacific (excluding high income)East Asia & Pacific (IDA & IBRD countries)EcuadorEgypt, Arab Rep.El SalvadorEquatorial GuineaEritreaEstoniaEthiopiaEuro areaEurope & Central AsiaEurope & Central Asia (excluding high income)Europe & Central Asia (IDA & IBRD countries)European UnionFijiFinlandFragile and conflict affected situationsFranceGabonGambia, TheGeorgiaGermanyGhanaGreeceGrenadaGuatemalaGuineaGuinea-BissauGuyanaHaitiHeavily indebted poor countries (HIPC)High incomeHondurasHong Kong SAR, ChinaHungaryIBRD onlyIcelandIDA & IBRD totalIDA blendIDA onlyIDA totalIndiaIndonesiaIran, Islamic Rep.IraqIrelandIsraelItalyJamaicaJapanJordanKazakhstanKenyaKorea, Dem. People’s Rep.Korea, Rep.KuwaitKyrgyz RepublicLao PDRLate-demographic dividendLatin America & Caribbean Latin America & Caribbean (excluding high income)Latin America & the Caribbean (IDA & IBRD countries)LatviaLeast developed countries: UN classificationLebanonLesothoLiberiaLibyaLiechtensteinLithuaniaLow & middle incomeLow incomeLower middle incomeLuxembourgMacao SAR, ChinaMacedonia, FYRMadagascarMalawiMalaysiaMaldivesMaliMaltaMarshall IslandsMauritaniaMauritiusMexicoMicronesia, Fed. Sts.Middle East & North AfricaMiddle East & North Africa (excluding high income)Middle East & North Africa (IDA & IBRD countries)Middle incomeMoldovaMongoliaMontenegroMoroccoMozambiqueMyanmarNamibiaNepalNetherlandsNew ZealandNicaraguaNigerNigeriaNorth AmericaNorwayOECD membersOmanOther small statesPacific island small statesPakistanPalauPanamaPapua New GuineaParaguayPeruPhilippinesPolandPortugalPost-demographic dividendPre-demographic dividendPuerto RicoQatarRomaniaRussian FederationRwandaSamoaSan MarinoSao Tome and PrincipeSaudi ArabiaSenegalSerbiaSeychellesSierra LeoneSingaporeSlovak RepublicSloveniaSmall statesSomaliaSouth AfricaSouth AsiaSouth Asia (IDA & IBRD)SpainSri LankaSt. Kitts and NevisSt. LuciaSt. Vincent and the GrenadinesSub-Saharan Africa Sub-Saharan Africa (excluding high income)Sub-Saharan Africa (IDA & IBRD countries)SudanSurinameSwazilandSwedenSwitzerlandSyrian Arab RepublicTajikistanTanzaniaThailandTimor-LesteTogoTongaTrinidad and TobagoTunisiaTurkeyTurkmenistanUgandaUkraineUnited Arab EmiratesUnited KingdomUnited StatesUpper middle incomeUruguayUzbekistanVanuatuVenezuela, RBVietnamWest Bank and GazaWorldYemen, Rep.ZambiaZimbabwe línea de tiempo (timeline):
En esta escala de tiempo se presenta un gráfico de 1972 y 2014 de Benin. Los datos de 1971 están ausentes. El número de observaciones reales por fecha: 42.
Fuente (nombre):
Indicadores del desarrollo mundial
Fuente (organización):
UNESCO Institute for Statistics
Categorías:
Education
Se ha actualizado:
23 abr 2017 año
Los indicadores de los cambios de valor en los últimos años
Mínimo:
0.129
1 ene 1972 año
Máximo:
15.363
1 ene 2014 año
A la fecha de observación
Valor
Cambio absoluto
El cambio con respecto al valor anterior
1 ene 1972 año
0.129
+0.129
0.0%
1 ene 1973 año
0.237
+0.108
83.35%
1 ene 1974 año
0.431
+0.195
82.14%
1 ene 1975 año
0.709
+0.278
64.41%
1 ene 1976 año
0.685
-0.024
-3.44%
1 ene 1977 año
0.74
+0.055
8.06%
1 ene 1978 año
0.984
+0.244
32.93%
1 ene 1979 año
1.087
+0.103
10.52%
1 ene 1980 año
0.964
-0.123
-11.32%
1 ene 1981 año
1.049
+0.085
8.77%
1 ene 1982 año
1.439
+0.39
37.21%
1 ene 1983 año
1.711
+0.272
18.88%
1 ene 1984 año
1.854
+0.143
8.38%
1 ene 1985 año
1.917
+0.063
3.42%
1 ene 1986 año
1.984
+0.067
3.5%
1 ene 1987 año
2.378
+0.393
19.82%
1 ene 1988 año
2.255
-0.122
-5.14%
1 ene 1989 año
2.189
-0.067
-2.95%
1 ene 1990 año
2.329
+0.14
6.38%
1 ene 1991 año
2.122
-0.206
-8.85%
1 ene 1992 año
2.421
+0.298
14.06%
1 ene 1993 año
2.271
-0.15
-6.18%
1 ene 1994 año
2.049
-0.223
-9.8%
1 ene 1995 año
2.092
+0.043
2.1%
1 ene 1996 año
2.09
-0.002
-0.09%
1 ene 1997 año
2.061
-0.028
-1.35%
1 ene 1998 año
2.511
+0.449
21.8%
1 ene 2000 año
3.23
+0.719
28.63%
1 ene 2001 año
3.681
+0.451
13.98%
1 ene 2002 año
4.464
+0.783
21.28%
1 ene 2003 año
5.265
+0.8
17.93%
1 ene 2004 año
5.82
+0.555
10.55%
1 ene 2005 año
5.872
+0.052
0.9%
1 ene 2006 año
5.784
-0.088
-1.49%
1 ene 2007 año
6.642
+0.858
14.83%
1 ene 2008 año
7.904
+1.262
19.0%
1 ene 2009 año
7.787
-0.117
-1.48%
1 ene 2010 año
9.87
+2.083
26.75%
1 ene 2011 año
13.26
+3.39
34.34%
1 ene 2012 año
12.365
-0.895
-6.75%
1 ene 2013 año
13.421
+1.056
8.54%
1 ene 2014 año
15.363
+1.942
14.47%
Ranking de los países por los datos estadísticos actuales


Comentarios: