29
/es/
es
AIzaSyAYiBZKx7MnpbEhh9jyipgxe19OcubqV5w
April 1, 2024
133201
Finland
FIN
true
2
1
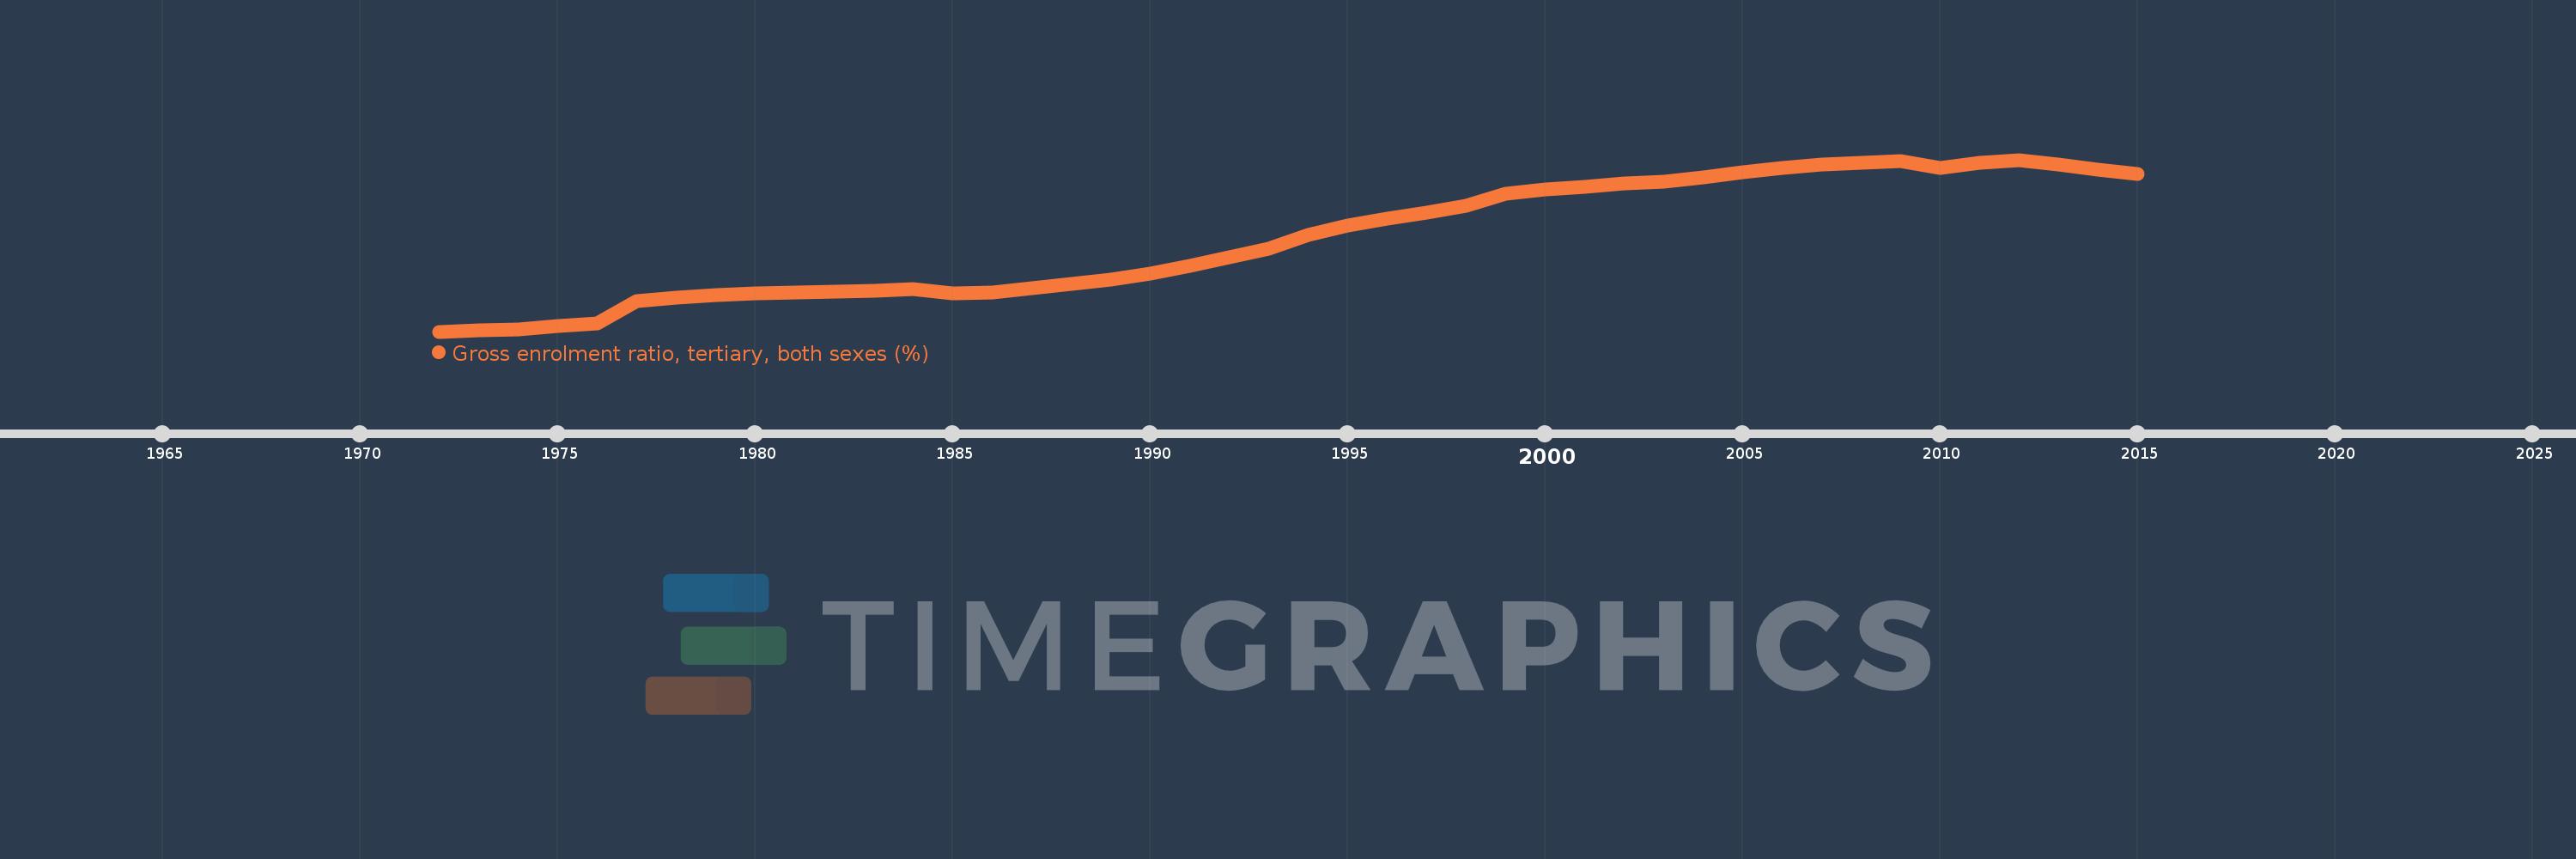
Gross enrolment ratio, tertiary, both sexes (%)
2015,2014,2013,2012,2011,2010,2009,2008,2007,2006,2005,2004,2003,2002,2001,2000,1999,1998,1997,1996,1995,1994,1993,1992,1991,1990,1989,1988,1987,1986,1985,1984,1983,1982,1981,1980,1979,1978,1977,1976,1975,1974,1973,1972
Estas estadísticas en otros países:
AfghanistanAlbaniaAlgeriaAngolaAntigua and BarbudaArab WorldArgentinaArmeniaArubaAustraliaAustriaAzerbaijanBahamas, TheBahrainBangladeshBarbadosBelarusBelgiumBelizeBeninBermudaBhutanBoliviaBosnia and HerzegovinaBotswanaBrazilBritish Virgin IslandsBrunei DarussalamBulgariaBurkina FasoBurundiCabo VerdeCambodiaCameroonCanadaCaribbean small statesCentral African RepublicCentral Europe and the BalticsChadChileChinaColombiaComorosCongo, Dem. Rep.Congo, Rep.Costa RicaCote d'IvoireCroatiaCubaCuracaoCyprusCzech RepublicDenmarkDjiboutiDominicaDominican RepublicEarly-demographic dividendEast Asia & PacificEast Asia & Pacific (excluding high income)East Asia & Pacific (IDA & IBRD countries)EcuadorEgypt, Arab Rep.El SalvadorEquatorial GuineaEritreaEstoniaEthiopiaEuro areaEurope & Central AsiaEurope & Central Asia (excluding high income)Europe & Central Asia (IDA & IBRD countries)European UnionFijiFinlandFragile and conflict affected situationsFranceGabonGambia, TheGeorgiaGermanyGhanaGreeceGrenadaGuatemalaGuineaGuinea-BissauGuyanaHaitiHeavily indebted poor countries (HIPC)High incomeHondurasHong Kong SAR, ChinaHungaryIBRD onlyIcelandIDA & IBRD totalIDA blendIDA onlyIDA totalIndiaIndonesiaIran, Islamic Rep.IraqIrelandIsraelItalyJamaicaJapanJordanKazakhstanKenyaKorea, Dem. People’s Rep.Korea, Rep.KuwaitKyrgyz RepublicLao PDRLate-demographic dividendLatin America & Caribbean Latin America & Caribbean (excluding high income)Latin America & the Caribbean (IDA & IBRD countries)LatviaLeast developed countries: UN classificationLebanonLesothoLiberiaLibyaLiechtensteinLithuaniaLow & middle incomeLow incomeLower middle incomeLuxembourgMacao SAR, ChinaMacedonia, FYRMadagascarMalawiMalaysiaMaldivesMaliMaltaMarshall IslandsMauritaniaMauritiusMexicoMicronesia, Fed. Sts.Middle East & North AfricaMiddle East & North Africa (excluding high income)Middle East & North Africa (IDA & IBRD countries)Middle incomeMoldovaMongoliaMontenegroMoroccoMozambiqueMyanmarNamibiaNepalNetherlandsNew ZealandNicaraguaNigerNigeriaNorth AmericaNorwayOECD membersOmanOther small statesPacific island small statesPakistanPalauPanamaPapua New GuineaParaguayPeruPhilippinesPolandPortugalPost-demographic dividendPre-demographic dividendPuerto RicoQatarRomaniaRussian FederationRwandaSamoaSan MarinoSao Tome and PrincipeSaudi ArabiaSenegalSerbiaSeychellesSierra LeoneSingaporeSlovak RepublicSloveniaSmall statesSomaliaSouth AfricaSouth AsiaSouth Asia (IDA & IBRD)SpainSri LankaSt. Kitts and NevisSt. LuciaSt. Vincent and the GrenadinesSub-Saharan Africa Sub-Saharan Africa (excluding high income)Sub-Saharan Africa (IDA & IBRD countries)SudanSurinameSwazilandSwedenSwitzerlandSyrian Arab RepublicTajikistanTanzaniaThailandTimor-LesteTogoTongaTrinidad and TobagoTunisiaTurkeyTurkmenistanUgandaUkraineUnited Arab EmiratesUnited KingdomUnited StatesUpper middle incomeUruguayUzbekistanVanuatuVenezuela, RBVietnamWest Bank and GazaWorldYemen, Rep.ZambiaZimbabwe línea de tiempo (timeline):
En esta escala de tiempo se presenta un gráfico de 1972 y 2015 de Finland. Los datos de 1971 están ausentes. El número de observaciones reales por fecha: 44.
Fuente (nombre):
Indicadores del desarrollo mundial
Fuente (organización):
UNESCO Institute for Statistics
Categorías:
Education
Se ha actualizado:
23 abr 2017 año
Los indicadores de los cambios de valor en los últimos años
Mínimo:
13.134
1 ene 1972 año
Máximo:
95.602
1 ene 2012 año
A la fecha de observación
Valor
Cambio absoluto
El cambio con respecto al valor anterior
1 ene 1972 año
13.134
+13.134
0.0%
1 ene 1973 año
13.651
+0.517
3.94%
1 ene 1974 año
14.291
+0.64
4.69%
1 ene 1975 año
15.73
+1.439
10.07%
1 ene 1976 año
16.955
+1.225
7.78%
1 ene 1977 año
27.651
+10.696
63.08%
1 ene 1978 año
29.395
+1.745
6.31%
1 ene 1979 año
30.689
+1.293
4.4%
1 ene 1980 año
31.293
+0.605
1.97%
1 ene 1981 año
31.757
+0.464
1.48%
1 ene 1982 año
32.152
+0.395
1.24%
1 ene 1983 año
32.666
+0.514
1.6%
1 ene 1984 año
33.405
+0.739
2.26%
1 ene 1985 año
31.493
-1.912
-5.72%
1 ene 1986 año
31.962
+0.469
1.49%
1 ene 1987 año
34.109
+2.147
6.72%
1 ene 1988 año
36.082
+1.973
5.78%
1 ene 1989 año
38.131
+2.049
5.68%
1 ene 1990 año
41.018
+2.887
7.57%
1 ene 1991 año
44.501
+3.483
8.49%
1 ene 1992 año
48.928
+4.427
9.95%
1 ene 1993 año
52.991
+4.063
8.3%
1 ene 1994 año
59.431
+6.44
12.15%
1 ene 1995 año
64.08
+4.65
7.82%
1 ene 1996 año
67.493
+3.412
5.33%
1 ene 1997 año
70.437
+2.944
4.36%
1 ene 1998 año
73.5
+3.063
4.35%
1 ene 1999 año
79.284
+5.784
7.87%
1 ene 2000 año
81.492
+2.208
2.79%
1 ene 2001 año
82.439
+0.947
1.16%
1 ene 2002 año
84.431
+1.991
2.42%
1 ene 2003 año
84.959
+0.529
0.63%
1 ene 2004 año
87.077
+2.118
2.49%
1 ene 2005 año
89.664
+2.587
2.97%
1 ene 2006 año
91.829
+2.165
2.41%
1 ene 2007 año
93.288
+1.459
1.59%
1 ene 2008 año
93.978
+0.69
0.74%
1 ene 2009 año
95.074
+1.097
1.17%
1 ene 2010 año
91.829
-3.245
-3.41%
1 ene 2011 año
94.119
+2.29
2.49%
1 ene 2012 año
95.602
+1.483
1.58%
1 ene 2013 año
93.281
-2.321
-2.43%
1 ene 2014 año
91.066
-2.215
-2.37%
1 ene 2015 año
88.672
-2.394
-2.63%
Ranking de los países por los datos estadísticos actuales


Comentarios: