29
/es/
es
AIzaSyAYiBZKx7MnpbEhh9jyipgxe19OcubqV5w
April 1, 2024
32650
Europe & Central Asia (IDA & IBRD countries)
TEC
false
2
1
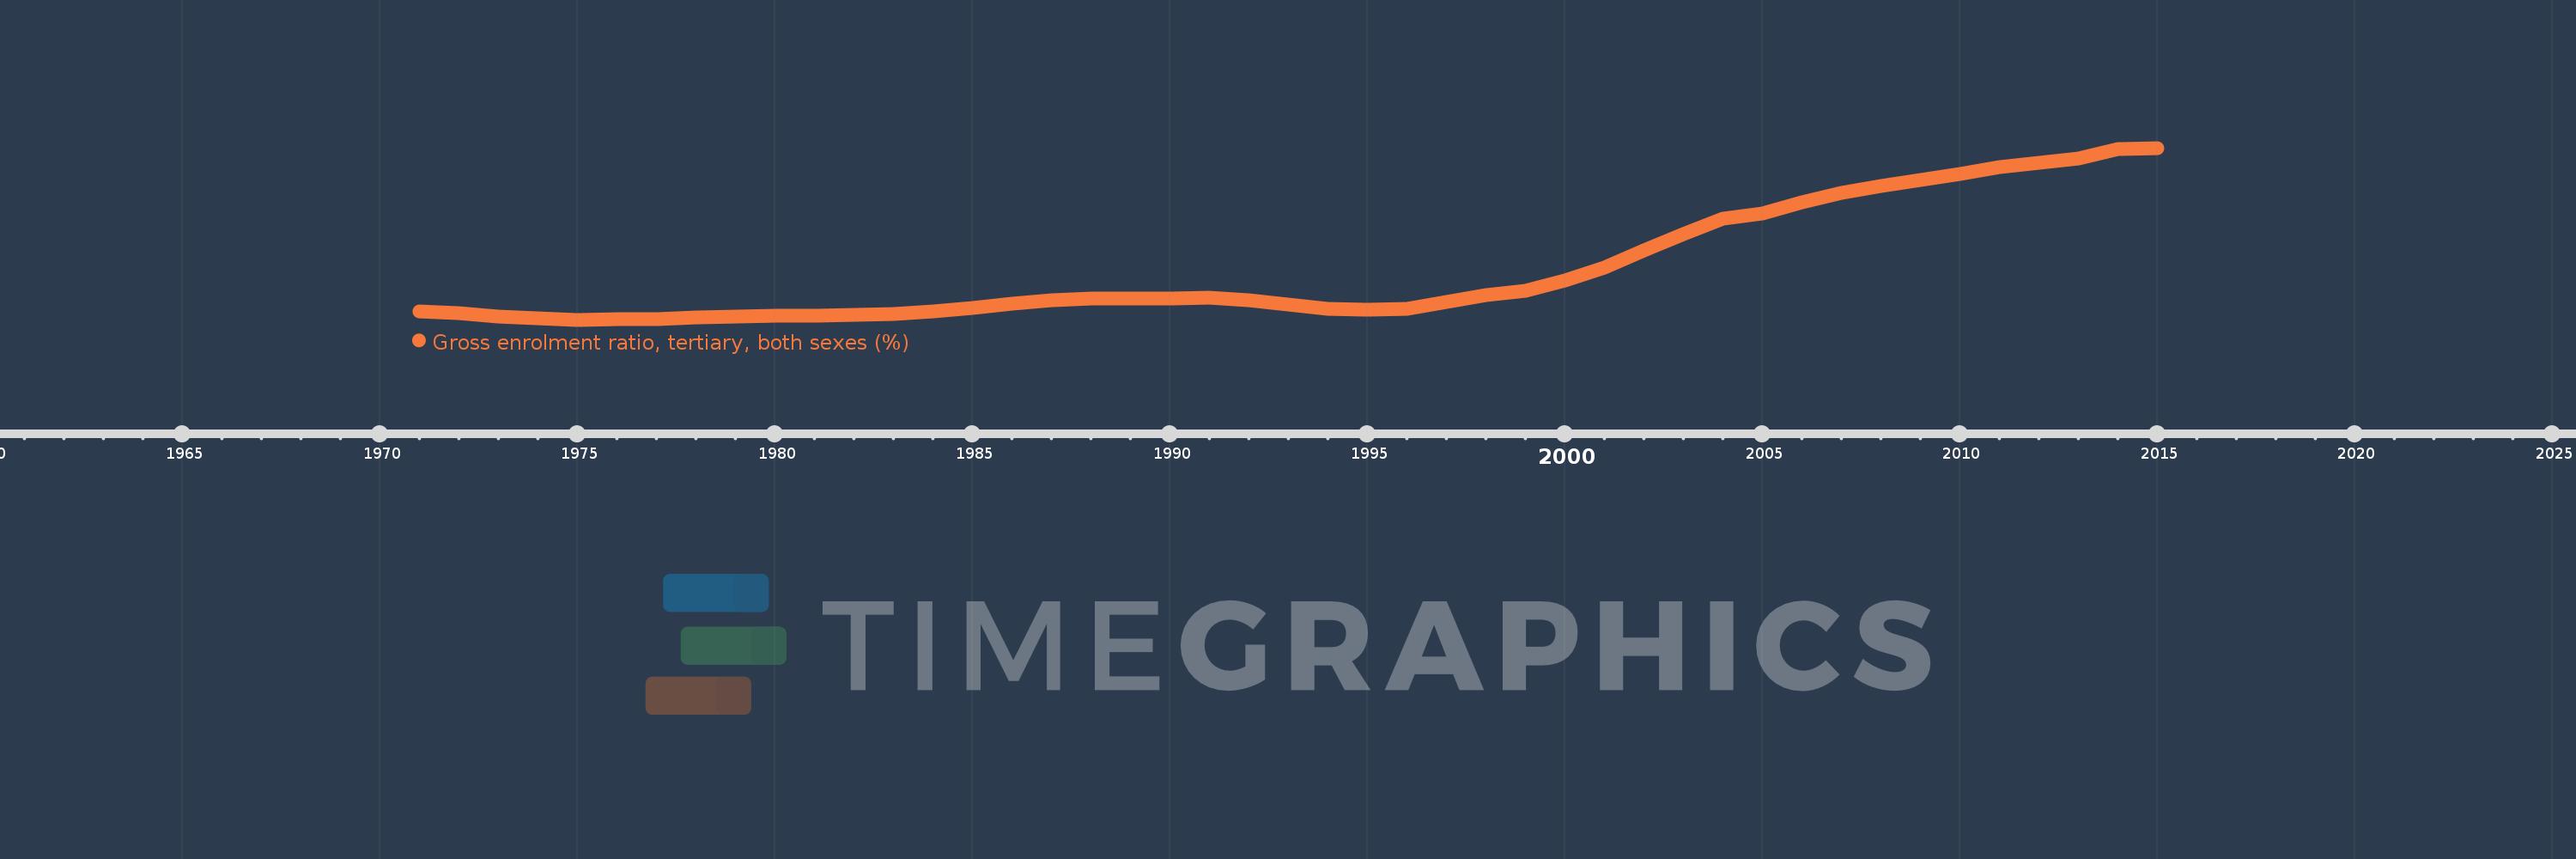
Gross enrolment ratio, tertiary, both sexes (%)
2015,2014,2013,2012,2011,2010,2009,2008,2007,2006,2005,2004,2003,2002,2001,2000,1999,1998,1997,1996,1995,1994,1993,1992,1991,1990,1989,1988,1987,1986,1985,1984,1983,1982,1981,1980,1979,1978,1977,1976,1975,1974,1973,1972,1971
Estas estadísticas en otros países:
AfghanistanAlbaniaAlgeriaAngolaAntigua and BarbudaArab WorldArgentinaArmeniaArubaAustraliaAustriaAzerbaijanBahamas, TheBahrainBangladeshBarbadosBelarusBelgiumBelizeBeninBermudaBhutanBoliviaBosnia and HerzegovinaBotswanaBrazilBritish Virgin IslandsBrunei DarussalamBulgariaBurkina FasoBurundiCabo VerdeCambodiaCameroonCanadaCaribbean small statesCentral African RepublicCentral Europe and the BalticsChadChileChinaColombiaComorosCongo, Dem. Rep.Congo, Rep.Costa RicaCote d'IvoireCroatiaCubaCuracaoCyprusCzech RepublicDenmarkDjiboutiDominicaDominican RepublicEarly-demographic dividendEast Asia & PacificEast Asia & Pacific (excluding high income)East Asia & Pacific (IDA & IBRD countries)EcuadorEgypt, Arab Rep.El SalvadorEquatorial GuineaEritreaEstoniaEthiopiaEuro areaEurope & Central AsiaEurope & Central Asia (excluding high income)Europe & Central Asia (IDA & IBRD countries)European UnionFijiFinlandFragile and conflict affected situationsFranceGabonGambia, TheGeorgiaGermanyGhanaGreeceGrenadaGuatemalaGuineaGuinea-BissauGuyanaHaitiHeavily indebted poor countries (HIPC)High incomeHondurasHong Kong SAR, ChinaHungaryIBRD onlyIcelandIDA & IBRD totalIDA blendIDA onlyIDA totalIndiaIndonesiaIran, Islamic Rep.IraqIrelandIsraelItalyJamaicaJapanJordanKazakhstanKenyaKorea, Dem. People’s Rep.Korea, Rep.KuwaitKyrgyz RepublicLao PDRLate-demographic dividendLatin America & Caribbean Latin America & Caribbean (excluding high income)Latin America & the Caribbean (IDA & IBRD countries)LatviaLeast developed countries: UN classificationLebanonLesothoLiberiaLibyaLiechtensteinLithuaniaLow & middle incomeLow incomeLower middle incomeLuxembourgMacao SAR, ChinaMacedonia, FYRMadagascarMalawiMalaysiaMaldivesMaliMaltaMarshall IslandsMauritaniaMauritiusMexicoMicronesia, Fed. Sts.Middle East & North AfricaMiddle East & North Africa (excluding high income)Middle East & North Africa (IDA & IBRD countries)Middle incomeMoldovaMongoliaMontenegroMoroccoMozambiqueMyanmarNamibiaNepalNetherlandsNew ZealandNicaraguaNigerNigeriaNorth AmericaNorwayOECD membersOmanOther small statesPacific island small statesPakistanPalauPanamaPapua New GuineaParaguayPeruPhilippinesPolandPortugalPost-demographic dividendPre-demographic dividendPuerto RicoQatarRomaniaRussian FederationRwandaSamoaSan MarinoSao Tome and PrincipeSaudi ArabiaSenegalSerbiaSeychellesSierra LeoneSingaporeSlovak RepublicSloveniaSmall statesSomaliaSouth AfricaSouth AsiaSouth Asia (IDA & IBRD)SpainSri LankaSt. Kitts and NevisSt. LuciaSt. Vincent and the GrenadinesSub-Saharan Africa Sub-Saharan Africa (excluding high income)Sub-Saharan Africa (IDA & IBRD countries)SudanSurinameSwazilandSwedenSwitzerlandSyrian Arab RepublicTajikistanTanzaniaThailandTimor-LesteTogoTongaTrinidad and TobagoTunisiaTurkeyTurkmenistanUgandaUkraineUnited Arab EmiratesUnited KingdomUnited StatesUpper middle incomeUruguayUzbekistanVanuatuVenezuela, RBVietnamWest Bank and GazaWorldYemen, Rep.ZambiaZimbabwe línea de tiempo (timeline):
En esta escala de tiempo se presenta un gráfico de 1971 y 2015 de Europe & Central Asia (IDA & IBRD countries). Los datos de 1970 están ausentes. El número de observaciones reales por fecha: 45.
Fuente (nombre):
Indicadores del desarrollo mundial
Fuente (organización):
UNESCO Institute for Statistics
Categorías:
Education
Se ha actualizado:
23 abr 2017 año
Los indicadores de los cambios de valor en los últimos años
Mínimo:
29.585
1 ene 1975 año
Máximo:
62.877
1 ene 2015 año
A la fecha de observación
Valor
Cambio absoluto
El cambio con respecto al valor anterior
1 ene 1971 año
31.176
+31.176
0.0%
1 ene 1972 año
30.805
-0.371
-1.19%
1 ene 1973 año
30.225
-0.581
-1.89%
1 ene 1974 año
29.832
-0.392
-1.3%
1 ene 1975 año
29.585
-0.247
-0.83%
1 ene 1976 año
29.638
+0.053
0.18%
1 ene 1977 año
29.779
+0.141
0.48%
1 ene 1978 año
30.094
+0.315
1.06%
1 ene 1979 año
30.261
+0.168
0.56%
1 ene 1980 año
30.309
+0.048
0.16%
1 ene 1981 año
30.316
+0.007
0.02%
1 ene 1982 año
30.497
+0.181
0.6%
1 ene 1983 año
30.758
+0.261
0.86%
1 ene 1984 año
31.206
+0.447
1.45%
1 ene 1985 año
31.89
+0.684
2.19%
1 ene 1986 año
32.769
+0.88
2.76%
1 ene 1987 año
33.289
+0.519
1.58%
1 ene 1988 año
33.679
+0.391
1.17%
1 ene 1989 año
33.737
+0.057
0.17%
1 ene 1990 año
33.702
-0.034
-0.1%
1 ene 1991 año
33.792
+0.09
0.27%
1 ene 1992 año
33.373
-0.419
-1.24%
1 ene 1993 año
32.507
-0.866
-2.59%
1 ene 1994 año
31.647
-0.86
-2.65%
1 ene 1995 año
31.61
-0.037
-0.12%
1 ene 1996 año
31.727
+0.117
0.37%
1 ene 1997 año
33.014
+1.287
4.06%
1 ene 1998 año
34.425
+1.411
4.27%
1 ene 1999 año
35.164
+0.738
2.14%
1 ene 2000 año
37.22
+2.056
5.85%
1 ene 2001 año
39.758
+2.539
6.82%
1 ene 2002 año
43.087
+3.329
8.37%
1 ene 2003 año
46.172
+3.085
7.16%
1 ene 2004 año
49.168
+2.997
6.49%
1 ene 2005 año
50.25
+1.082
2.2%
1 ene 2006 año
52.345
+2.095
4.17%
1 ene 2007 año
54.207
+1.861
3.56%
1 ene 2008 año
55.575
+1.369
2.53%
1 ene 2009 año
56.69
+1.115
2.01%
1 ene 2010 año
57.805
+1.114
1.97%
1 ene 2011 año
59.169
+1.365
2.36%
1 ene 2012 año
59.967
+0.798
1.35%
1 ene 2013 año
60.873
+0.905
1.51%
1 ene 2014 año
62.706
+1.833
3.01%
1 ene 2015 año
62.877
+0.171
0.27%
Ranking de los países por los datos estadísticos actuales


Comentarios: