29
/es/
es
AIzaSyAYiBZKx7MnpbEhh9jyipgxe19OcubqV5w
April 1, 2024
82474
Belize
BLZ
true
2
1
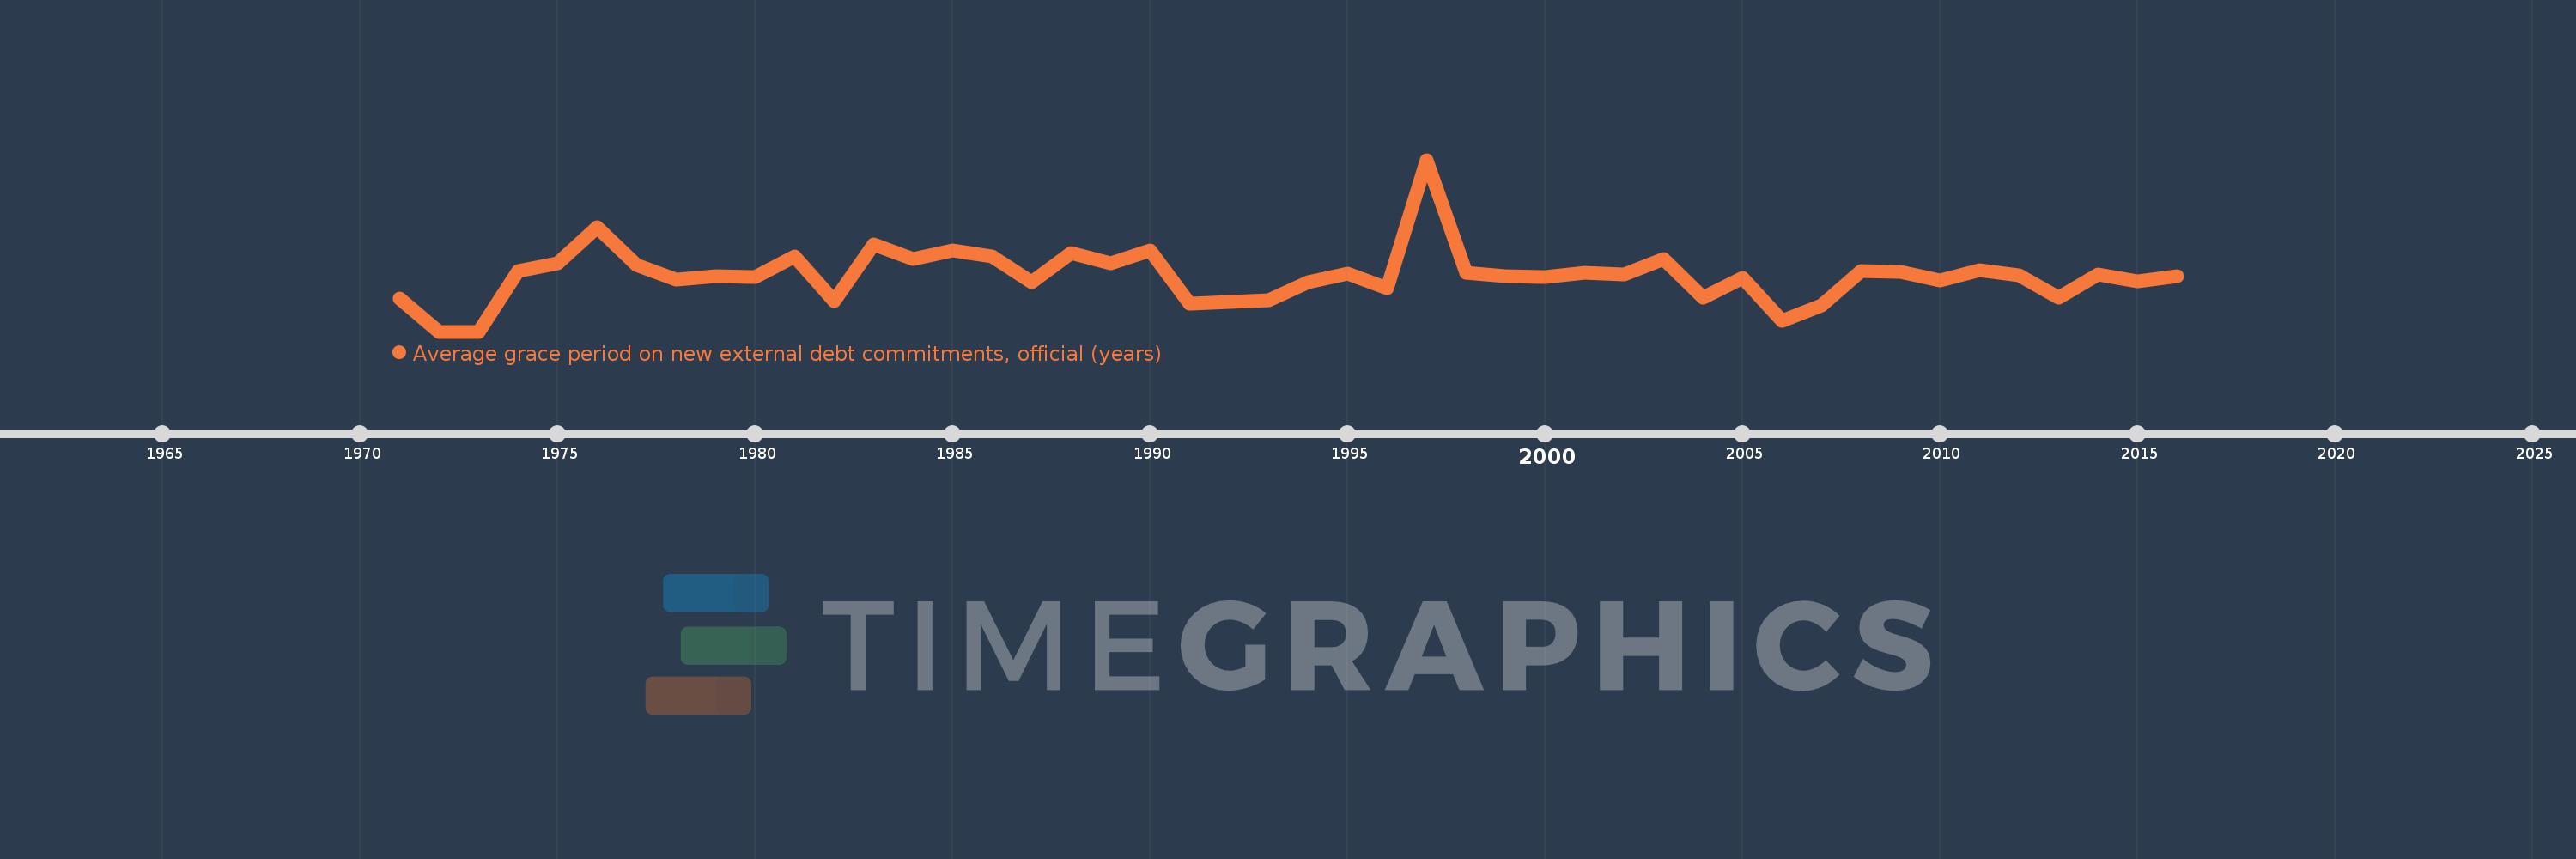
Average grace period on new external debt commitments, official (years)
2016,2015,2014,2013,2012,2011,2010,2009,2008,2007,2006,2005,2004,2003,2002,2001,2000,1999,1998,1997,1996,1995,1994,1993,1992,1991,1990,1989,1988,1987,1986,1985,1984,1983,1982,1981,1980,1979,1978,1977,1976,1975,1974,1973,1972,1971
Estas estadísticas en otros países:
línea de tiempo (timeline):
En esta escala de tiempo se presenta un gráfico de 1971 y 2016 de Belize. Los datos de 1970 están ausentes. El número de observaciones reales por fecha: 46.
Fuente (nombre):
Indicadores del desarrollo mundial
Fuente (organización):
World Bank, International Debt Statistics.
Categorías:
External Debt
Se ha actualizado:
23 abr 2017 año
Los indicadores de los cambios de valor en los últimos años
Máximo:
15.436
1 ene 1997 año
A la fecha de observación
Valor
Cambio absoluto
El cambio con respecto al valor anterior
1 ene 1971 año
3.0
+3.0
0.0%
1 ene 1972 año
0.0
-3.0
-100.0%
1 ene 1974 año
5.435
+5.435
%
1 ene 1975 año
6.124
+0.689
12.68%
1 ene 1976 año
9.342
+3.217
52.54%
1 ene 1977 año
5.95
-3.391
-36.3%
1 ene 1978 año
4.695
-1.256
-21.1%
1 ene 1979 año
4.991
+0.297
6.32%
1 ene 1980 año
4.906
-0.085
-1.71%
1 ene 1981 año
6.789
+1.882
38.37%
1 ene 1982 año
2.75
-4.038
-59.49%
1 ene 1983 año
7.816
+5.066
184.18%
1 ene 1984 año
6.558
-1.258
-16.1%
1 ene 1985 año
7.329
+0.771
11.76%
1 ene 1986 año
6.737
-0.592
-8.08%
1 ene 1987 año
4.4
-2.337
-34.69%
1 ene 1988 año
7.081
+2.681
60.94%
1 ene 1989 año
6.116
-0.965
-13.63%
1 ene 1990 año
7.279
+1.163
19.01%
1 ene 1991 año
2.5
-4.779
-65.65%
1 ene 1992 año
2.643
+0.143
5.7%
1 ene 1993 año
2.825
+0.182
6.9%
1 ene 1994 año
4.415
+1.59
56.29%
1 ene 1995 año
5.221
+0.806
18.25%
1 ene 1996 año
3.915
-1.306
-25.01%
1 ene 1997 año
15.436
+11.521
294.25%
1 ene 1998 año
5.289
-10.147
-65.74%
1 ene 1999 año
4.949
-0.34
-6.43%
1 ene 2000 año
4.918
-0.031
-0.62%
1 ene 2001 año
5.304
+0.386
7.85%
1 ene 2002 año
5.134
-0.17
-3.21%
1 ene 2003 año
6.525
+1.391
27.09%
1 ene 2004 año
3.023
-3.502
-53.67%
1 ene 2005 año
4.818
+1.795
59.39%
1 ene 2006 año
1.0
-3.818
-79.24%
1 ene 2007 año
2.351
+1.351
135.14%
1 ene 2008 año
5.428
+3.077
130.85%
1 ene 2009 año
5.337
-0.091
-1.67%
1 ene 2010 año
4.569
-0.769
-14.4%
1 ene 2011 año
5.531
+0.962
21.05%
1 ene 2012 año
5.086
-0.445
-8.04%
1 ene 2013 año
3.016
-2.07
-40.7%
1 ene 2014 año
5.096
+2.08
68.98%
1 ene 2015 año
4.529
-0.568
-11.14%
1 ene 2016 año
4.944
+0.416
9.18%
Ranking de los países por los datos estadísticos actuales


Comentarios: