29
/es/
es
AIzaSyAYiBZKx7MnpbEhh9jyipgxe19OcubqV5w
April 1, 2024
102156
Central African Republic
CAF
true
2
1
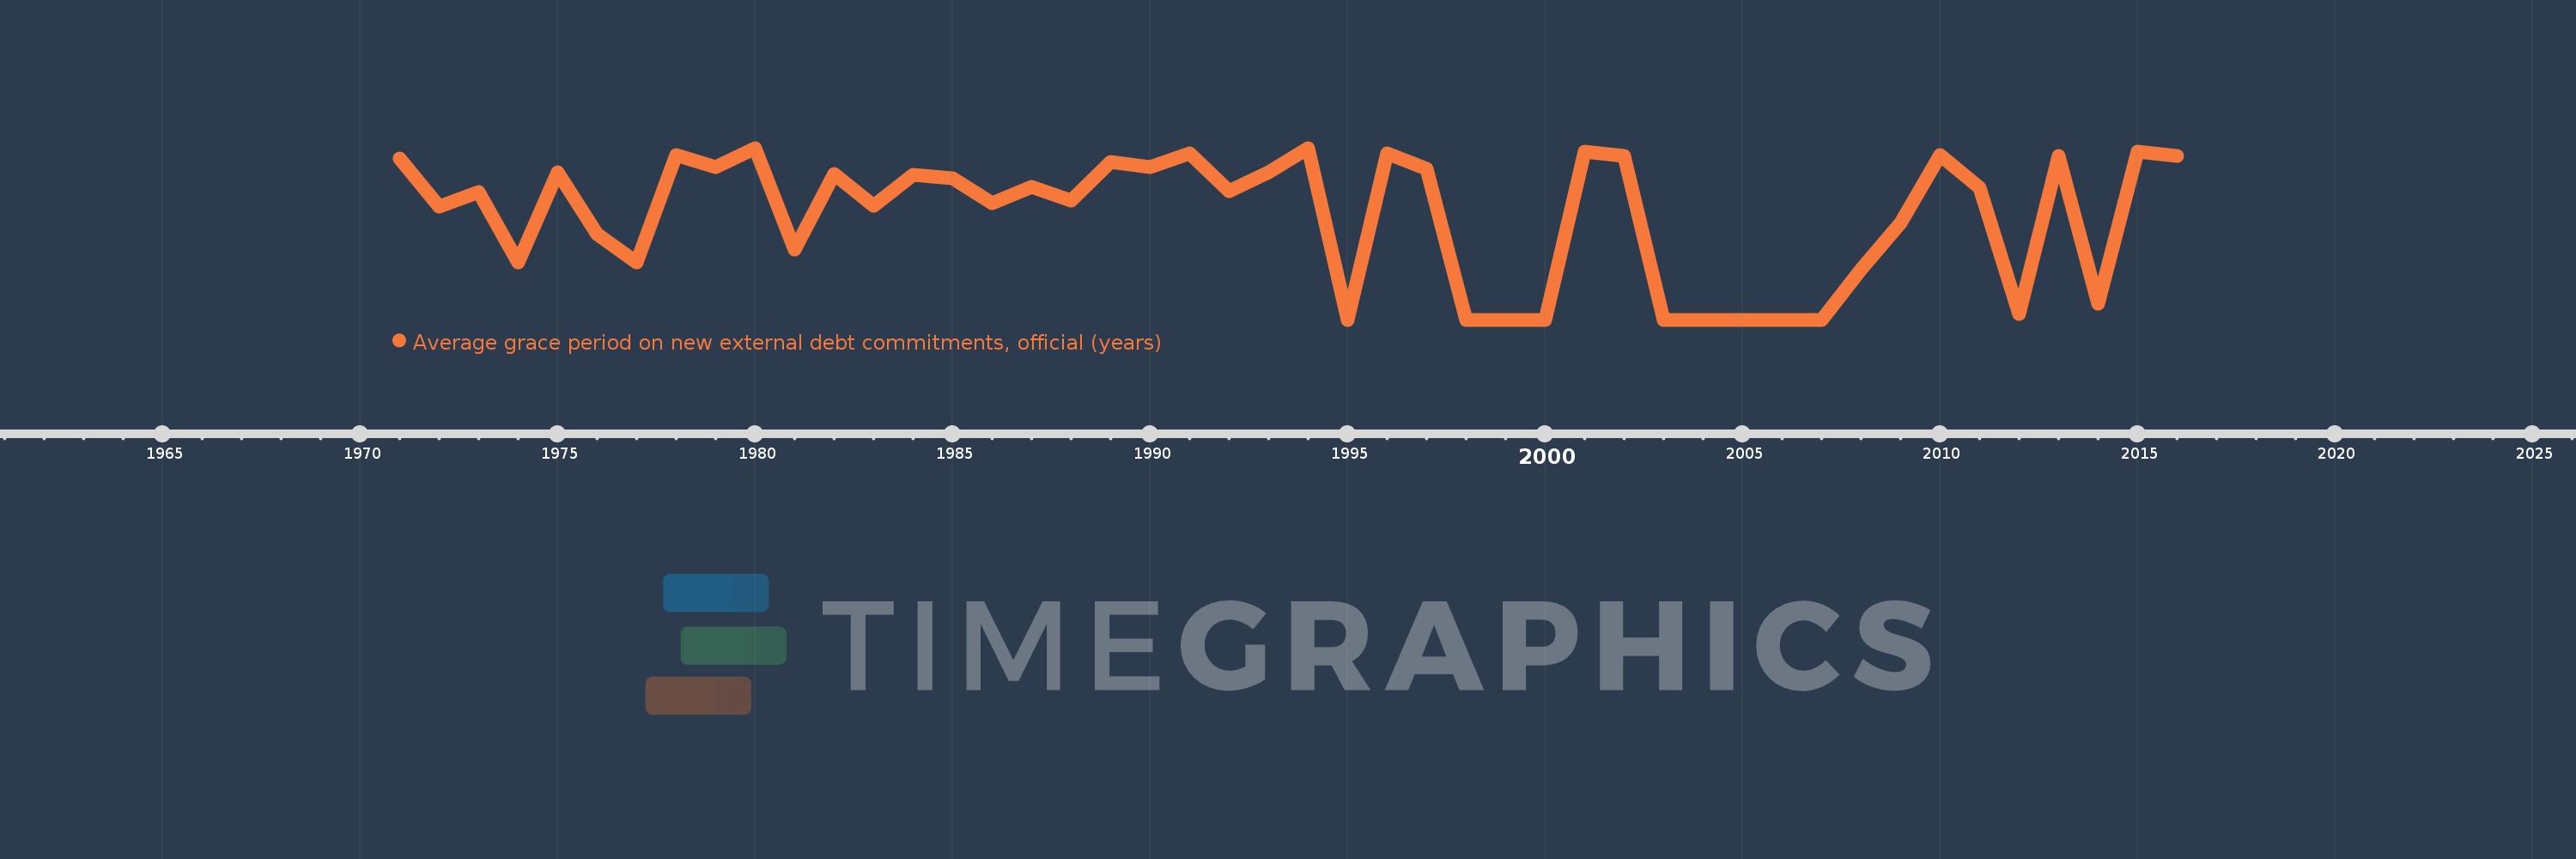
Average grace period on new external debt commitments, official (years)
2016,2015,2014,2013,2012,2011,2010,2009,2008,2007,2006,2005,2004,2003,2002,2001,2000,1999,1998,1997,1996,1995,1994,1993,1992,1991,1990,1989,1988,1987,1986,1985,1984,1983,1982,1981,1980,1979,1978,1977,1976,1975,1974,1973,1972,1971
Estas estadísticas en otros países:
línea de tiempo (timeline):
En esta escala de tiempo se presenta un gráfico de 1971 y 2016 de Central African Republic. Los datos de 1970 están ausentes. El número de observaciones reales por fecha: 46.
Fuente (nombre):
Indicadores del desarrollo mundial
Fuente (organización):
World Bank, International Debt Statistics.
Categorías:
External Debt
Se ha actualizado:
23 abr 2017 año
Los indicadores de los cambios de valor en los últimos años
Máximo:
10.505
1 ene 1980 año
A la fecha de observación
Valor
Cambio absoluto
El cambio con respecto al valor anterior
1 ene 1971 año
9.856
+9.856
0.0%
1 ene 1972 año
6.943
-2.913
-29.56%
1 ene 1973 año
7.823
+0.88
12.68%
1 ene 1974 año
3.5
-4.323
-55.26%
1 ene 1975 año
8.994
+5.494
156.97%
1 ene 1976 año
5.247
-3.747
-41.66%
1 ene 1977 año
3.491
-1.757
-33.48%
1 ene 1978 año
10.066
+6.575
188.37%
1 ene 1979 año
9.343
-0.723
-7.18%
1 ene 1980 año
10.505
+1.162
12.43%
1 ene 1981 año
4.293
-6.212
-59.13%
1 ene 1982 año
8.922
+4.629
107.83%
1 ene 1983 año
6.996
-1.926
-21.59%
1 ene 1984 año
8.873
+1.878
26.84%
1 ene 1985 año
8.666
-0.208
-2.34%
1 ene 1986 año
7.121
-1.544
-17.82%
1 ene 1987 año
8.101
+0.979
13.75%
1 ene 1988 año
7.282
-0.819
-10.11%
1 ene 1989 año
9.672
+2.391
32.83%
1 ene 1990 año
9.353
-0.319
-3.29%
1 ene 1991 año
10.169
+0.816
8.72%
1 ene 1992 año
7.847
-2.323
-22.84%
1 ene 1993 año
8.996
+1.149
14.64%
1 ene 1994 año
10.476
+1.481
16.46%
1 ene 1995 año
0.0
-10.476
-100.0%
1 ene 1996 año
10.2
+10.2
%
1 ene 1997 año
9.25
-0.95
-9.31%
1 ene 1998 año
0.0
-9.25
-100.0%
1 ene 2001 año
10.298
+10.298
%
1 ene 2002 año
10.0
-0.298
-2.89%
1 ene 2003 año
0.0
-10.0
-100.0%
1 ene 2008 año
3.083
+3.083
%
1 ene 2009 año
5.917
+2.833
91.89%
1 ene 2010 año
10.083
+4.167
70.42%
1 ene 2011 año
8.054
-2.029
-20.12%
1 ene 2012 año
0.357
-7.697
-95.56%
1 ene 2013 año
9.996
+9.639
2.7 mil%
1 ene 2014 año
1.0
-8.996
-90.0%
1 ene 2015 año
10.289
+9.289
928.89%
1 ene 2016 año
10.0
-0.289
-2.81%
Ranking de los países por los datos estadísticos actuales


Comentarios: