29
/es/
es
AIzaSyAYiBZKx7MnpbEhh9jyipgxe19OcubqV5w
April 1, 2024
254890
Swaziland
SWZ
true
2
1
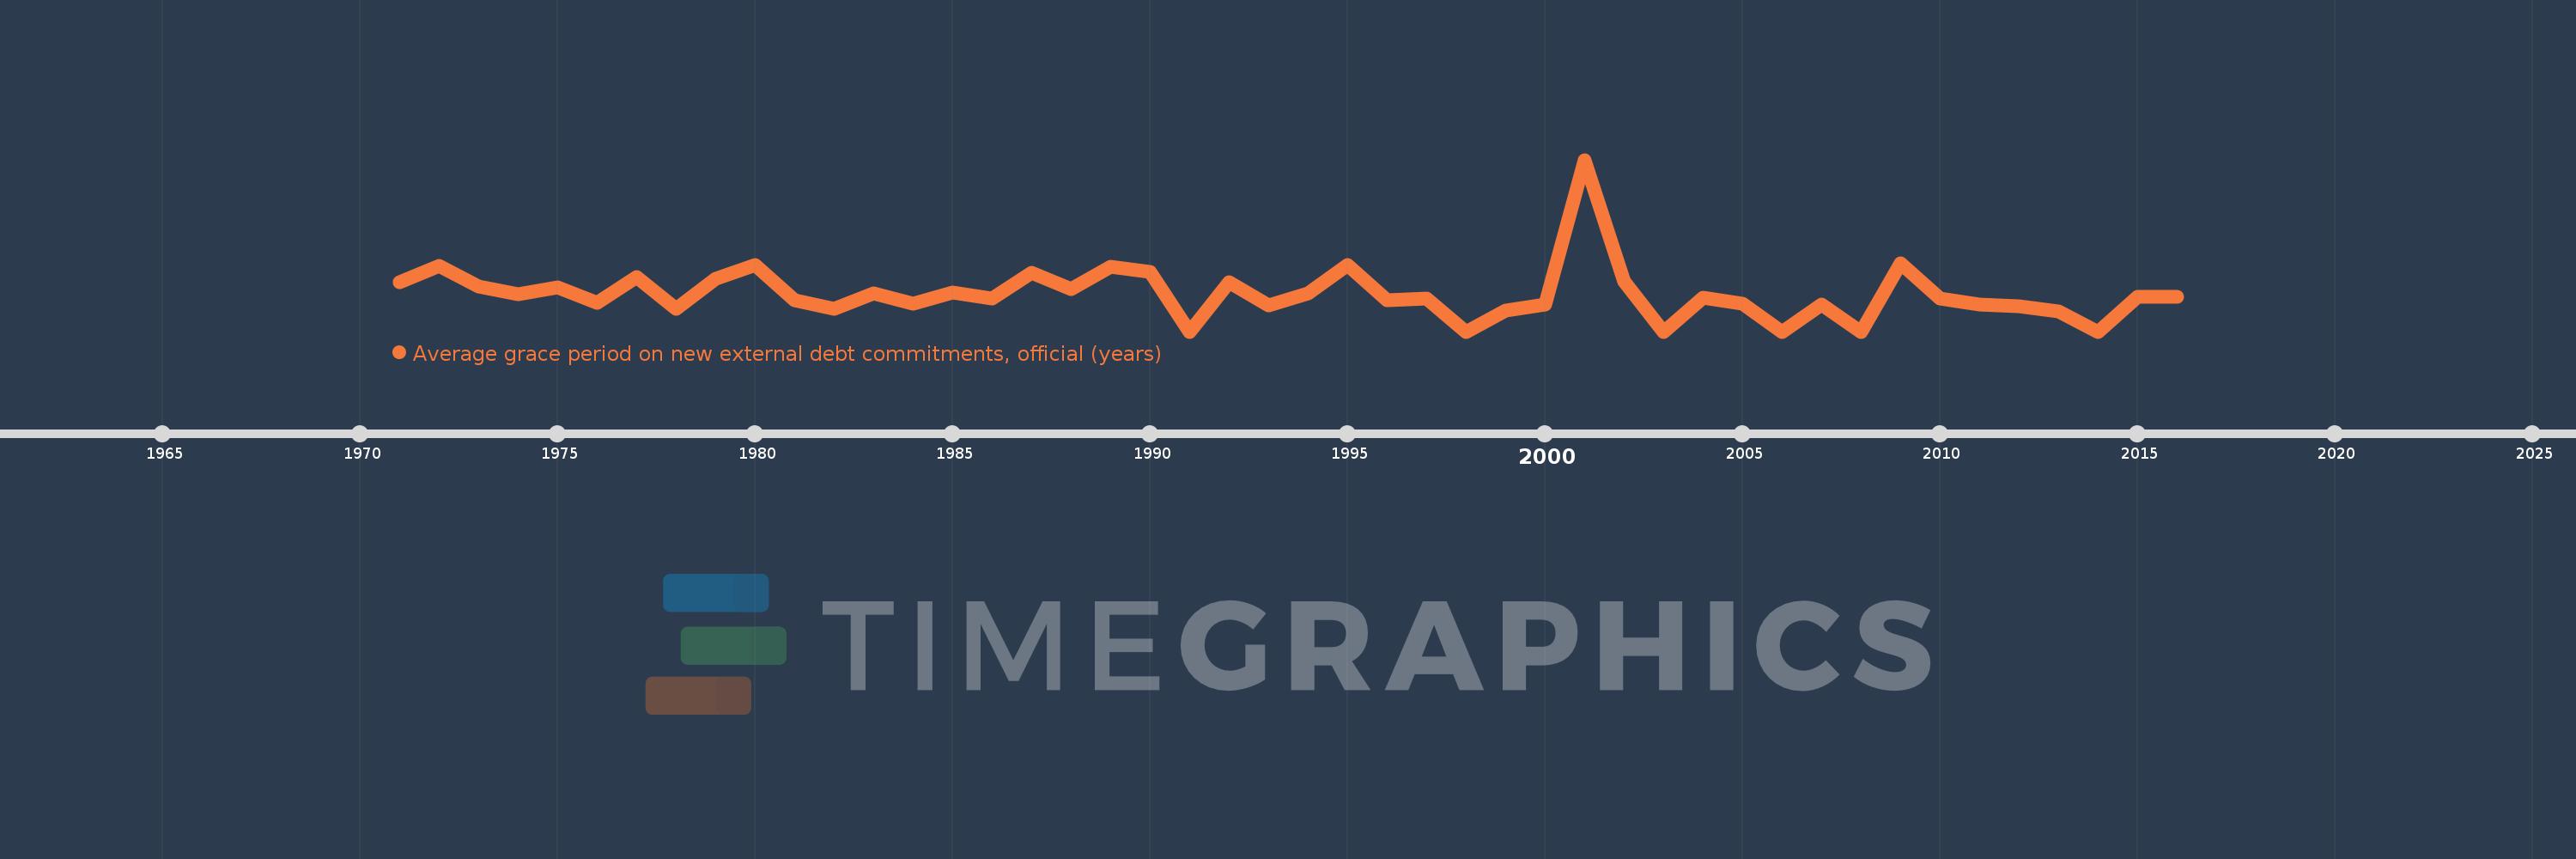
Average grace period on new external debt commitments, official (years)
2016,2015,2014,2013,2012,2011,2010,2009,2008,2007,2006,2005,2004,2003,2002,2001,2000,1999,1998,1997,1996,1995,1994,1993,1992,1991,1990,1989,1988,1987,1986,1985,1984,1983,1982,1981,1980,1979,1978,1977,1976,1975,1974,1973,1972,1971
Estas estadísticas en otros países:
línea de tiempo (timeline):
En esta escala de tiempo se presenta un gráfico de 1971 y 2016 de Swaziland. Los datos de 1970 están ausentes. El número de observaciones reales por fecha: 46.
Fuente (nombre):
Indicadores del desarrollo mundial
Fuente (organización):
World Bank, International Debt Statistics.
Categorías:
External Debt
Se ha actualizado:
23 abr 2017 año
Los indicadores de los cambios de valor en los últimos años
Máximo:
27.167
1 ene 2001 año
A la fecha de observación
Valor
Cambio absoluto
El cambio con respecto al valor anterior
1 ene 1971 año
7.747
+7.747
0.0%
1 ene 1972 año
10.386
+2.639
34.06%
1 ene 1973 año
7.1
-3.286
-31.64%
1 ene 1974 año
5.87
-1.23
-17.32%
1 ene 1975 año
7.009
+1.139
19.4%
1 ene 1976 año
4.592
-2.417
-34.48%
1 ene 1977 año
8.67
+4.078
88.79%
1 ene 1978 año
3.583
-5.087
-58.67%
1 ene 1979 año
8.346
+4.763
132.9%
1 ene 1980 año
10.523
+2.177
26.08%
1 ene 1981 año
5.014
-5.509
-52.35%
1 ene 1982 año
3.623
-1.391
-27.74%
1 ene 1983 año
6.057
+2.433
67.16%
1 ene 1984 año
4.358
-1.699
-28.05%
1 ene 1985 año
6.17
+1.812
41.58%
1 ene 1986 año
5.162
-1.008
-16.34%
1 ene 1987 año
9.322
+4.16
80.58%
1 ene 1988 año
6.676
-2.646
-28.38%
1 ene 1989 año
10.2
+3.524
52.79%
1 ene 1990 año
9.378
-0.822
-8.06%
1 ene 1991 año
0.0
-9.378
-100.0%
1 ene 1992 año
7.833
+7.833
%
1 ene 1993 año
4.2
-3.633
-46.38%
1 ene 1994 año
6.032
+1.832
43.63%
1 ene 1995 año
10.5
+4.468
74.06%
1 ene 1996 año
5.0
-5.5
-52.38%
1 ene 1997 año
5.198
+0.198
3.97%
1 ene 1998 año
0.0
-5.198
-100.0%
1 ene 1999 año
3.312
+3.312
%
1 ene 2000 año
4.212
+0.9
27.18%
1 ene 2001 año
27.167
+22.954
544.94%
1 ene 2002 año
7.966
-19.2
-70.68%
1 ene 2003 año
0.0
-7.966
-100.0%
1 ene 2004 año
5.363
+5.363
%
1 ene 2005 año
4.406
-0.956
-17.83%
1 ene 2006 año
0.0
-4.406
-100.0%
1 ene 2007 año
4.333
+4.333
%
1 ene 2008 año
0.0
-4.333
-100.0%
1 ene 2009 año
10.769
+10.769
%
1 ene 2010 año
5.241
-5.528
-51.33%
1 ene 2011 año
4.27
-0.971
-18.53%
1 ene 2012 año
3.993
-0.277
-6.48%
1 ene 2013 año
3.169
-0.824
-20.63%
1 ene 2014 año
0.0
-3.169
-100.0%
1 ene 2016 año
5.439
-0.061
-1.11%
Ranking de los países por los datos estadísticos actuales


Comentarios: