29
/es/
es
AIzaSyAYiBZKx7MnpbEhh9jyipgxe19OcubqV5w
April 1, 2024
82440
Belize
BLZ
true
2
1
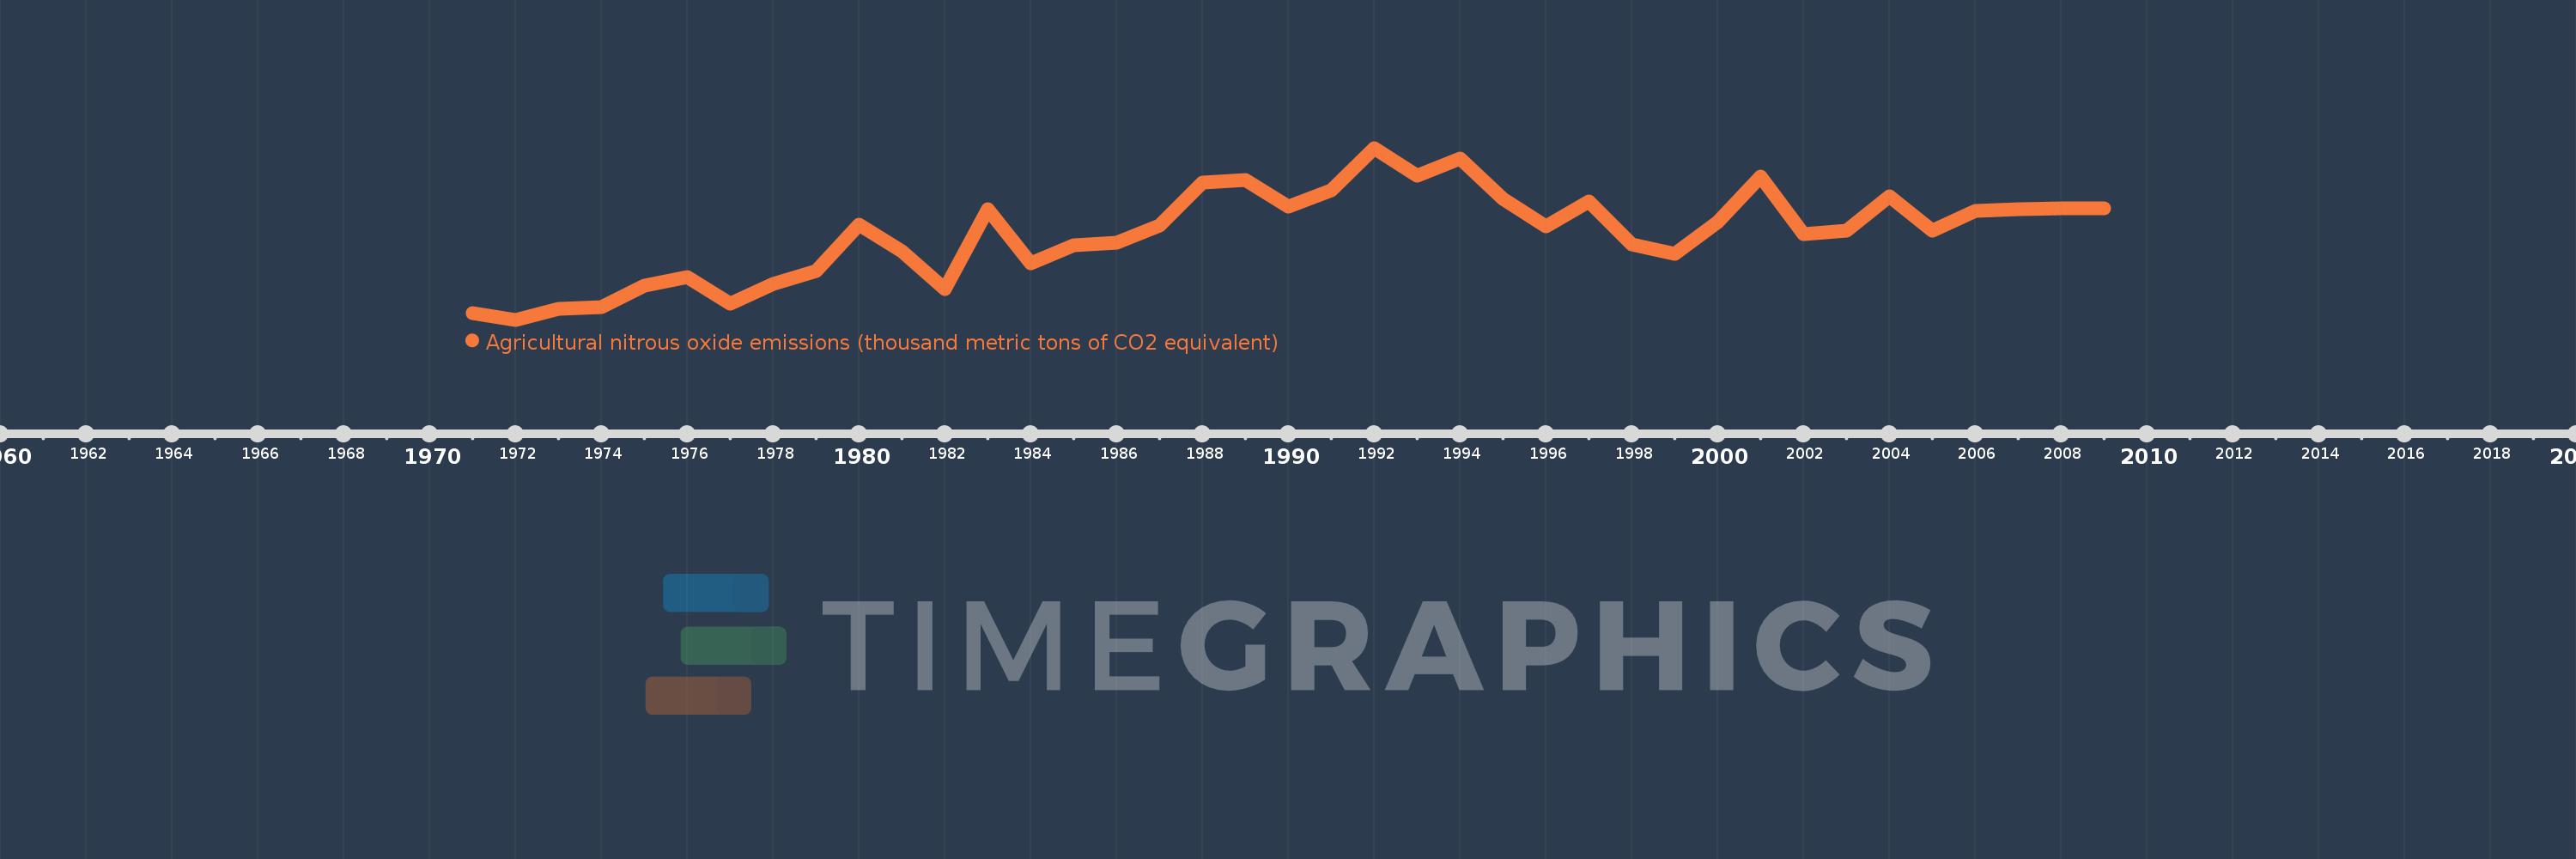
Agricultural nitrous oxide emissions (thousand metric tons of CO2 equivalent)
2009,2008,2007,2006,2005,2004,2003,2002,2001,2000,1999,1998,1997,1996,1995,1994,1993,1992,1991,1990,1989,1988,1987,1986,1985,1984,1983,1982,1981,1980,1979,1978,1977,1976,1975,1974,1973,1972,1971
Estas estadísticas en otros países:
AfghanistanAlbaniaAlgeriaAmerican SamoaAndorraAngolaAntigua and BarbudaArab WorldArgentinaArmeniaArubaAustraliaAustriaAzerbaijanBahamas, TheBahrainBangladeshBarbadosBelarusBelgiumBelizeBeninBermudaBhutanBoliviaBosnia and HerzegovinaBotswanaBrazilBritish Virgin IslandsBrunei DarussalamBulgariaBurkina FasoBurundiCabo VerdeCambodiaCameroonCanadaCaribbean small statesCayman IslandsCentral African RepublicCentral Europe and the BalticsChadChannel IslandsChileChinaColombiaComorosCongo, Dem. Rep.Congo, Rep.Costa RicaCote d'IvoireCroatiaCubaCuracaoCyprusCzech RepublicDenmarkDjiboutiDominicaDominican RepublicEarly-demographic dividendEast Asia & PacificEast Asia & Pacific (excluding high income)East Asia & Pacific (IDA & IBRD countries)EcuadorEgypt, Arab Rep.El SalvadorEquatorial GuineaEritreaEstoniaEthiopiaEuro areaEurope & Central AsiaEurope & Central Asia (excluding high income)Europe & Central Asia (IDA & IBRD countries)European UnionFaroe IslandsFijiFinlandFragile and conflict affected situationsFranceFrench PolynesiaGabonGambia, TheGeorgiaGermanyGhanaGibraltarGreeceGreenlandGrenadaGuamGuatemalaGuineaGuinea-BissauGuyanaHaitiHeavily indebted poor countries (HIPC)High incomeHondurasHong Kong SAR, ChinaHungaryIBRD onlyIcelandIDA & IBRD totalIDA blendIDA onlyIDA totalIndiaIndonesiaIran, Islamic Rep.IraqIrelandIsle of ManIsraelItalyJamaicaJapanJordanKazakhstanKenyaKiribatiKorea, Dem. People’s Rep.Korea, Rep.KosovoKuwaitKyrgyz RepublicLao PDRLate-demographic dividendLatin America & Caribbean Latin America & Caribbean (excluding high income)Latin America & the Caribbean (IDA & IBRD countries)LatviaLeast developed countries: UN classificationLebanonLesothoLiberiaLibyaLiechtensteinLithuaniaLow & middle incomeLow incomeLower middle incomeLuxembourgMacao SAR, ChinaMacedonia, FYRMadagascarMalawiMalaysiaMaldivesMaliMaltaMarshall IslandsMauritaniaMauritiusMexicoMicronesia, Fed. Sts.Middle East & North AfricaMiddle East & North Africa (excluding high income)Middle East & North Africa (IDA & IBRD countries)Middle incomeMoldovaMonacoMongoliaMontenegroMoroccoMozambiqueMyanmarNamibiaNauruNepalNetherlandsNew CaledoniaNew ZealandNicaraguaNigerNigeriaNorth AmericaNorthern Mariana IslandsNorwayOECD membersOmanOther small statesPacific island small statesPakistanPalauPanamaPapua New GuineaParaguayPeruPhilippinesPolandPortugalPost-demographic dividendPre-demographic dividendPuerto RicoQatarRomaniaRussian FederationRwandaSamoaSan MarinoSao Tome and PrincipeSaudi ArabiaSenegalSerbiaSeychellesSierra LeoneSingaporeSint Maarten (Dutch part)Slovak RepublicSloveniaSmall statesSolomon IslandsSomaliaSouth AfricaSouth AsiaSouth Asia (IDA & IBRD)South SudanSpainSri LankaSt. Kitts and NevisSt. LuciaSt. Martin (French part)St. Vincent and the GrenadinesSub-Saharan Africa Sub-Saharan Africa (excluding high income)Sub-Saharan Africa (IDA & IBRD countries)SudanSurinameSwazilandSwedenSwitzerlandSyrian Arab RepublicTajikistanTanzaniaThailandTimor-LesteTogoTongaTrinidad and TobagoTunisiaTurkeyTurkmenistanTurks and Caicos IslandsTuvaluUgandaUkraineUnited Arab EmiratesUnited KingdomUnited StatesUpper middle incomeUruguayUzbekistanVanuatuVenezuela, RBVietnamVirgin Islands (U.S.)West Bank and GazaWorldYemen, Rep.ZambiaZimbabwe línea de tiempo (timeline):
En esta escala de tiempo se presenta un gráfico de 1971 y 2009 de Belize. Los datos de 1970 están ausentes. El número de observaciones reales por fecha: 39.
Fuente (nombre):
Indicadores del desarrollo mundial
Fuente (organización):
European Commission, Joint Research Centre (JRC)/Netherlands Environmental Assessment Agency (PBL). Emission Database for Global Atmospheric Research (EDGAR): http://edgar.jrc.ec.europa.eu/
Categorías:
Agriculture & Rural Development, Environment
Se ha actualizado:
23 abr 2017 año
Los indicadores de los cambios de valor en los últimos años
Mínimo:
75.138
1 ene 1972 año
Máximo:
121.771
1 ene 1992 año
A la fecha de observación
Valor
Cambio absoluto
El cambio con respecto al valor anterior
1 ene 1971 año
76.962
+76.962
0.0%
1 ene 1972 año
75.138
-1.824
-2.37%
1 ene 1973 año
77.994
+2.857
3.8%
1 ene 1974 año
78.665
+0.671
0.86%
1 ene 1975 año
84.388
+5.723
7.27%
1 ene 1976 año
86.658
+2.27
2.69%
1 ene 1977 año
79.41
-7.248
-8.36%
1 ene 1978 año
84.892
+5.483
6.9%
1 ene 1979 año
88.369
+3.477
4.1%
1 ene 1980 año
100.94
+12.571
14.23%
1 ene 1981 año
93.632
-7.309
-7.24%
1 ene 1982 año
83.475
-10.157
-10.85%
1 ene 1983 año
105.19
+21.715
26.01%
1 ene 1984 año
90.505
-14.684
-13.96%
1 ene 1985 año
95.344
+4.839
5.35%
1 ene 1986 año
96.076
+0.732
0.77%
1 ene 1987 año
100.697
+4.621
4.81%
1 ene 1988 año
112.274
+11.577
11.5%
1 ene 1989 año
113.02
+0.746
0.66%
1 ene 1990 año
105.848
-7.172
-6.35%
1 ene 1991 año
110.367
+4.52
4.27%
1 ene 1992 año
121.771
+11.404
10.33%
1 ene 1993 año
114.317
-7.454
-6.12%
1 ene 1994 año
118.851
+4.534
3.97%
1 ene 1995 año
107.999
-10.852
-9.13%
1 ene 1996 año
100.452
-7.547
-6.99%
1 ene 1997 año
107.312
+6.86
6.83%
1 ene 1998 año
95.555
-11.757
-10.96%
1 ene 1999 año
93.121
-2.434
-2.55%
1 ene 2000 año
101.726
+8.605
9.24%
1 ene 2001 año
114.016
+12.29
12.08%
1 ene 2002 año
98.278
-15.738
-13.8%
1 ene 2003 año
99.355
+1.077
1.1%
1 ene 2004 año
108.634
+9.279
9.34%
1 ene 2005 año
99.32
-9.314
-8.57%
1 ene 2006 año
104.746
+5.426
5.46%
1 ene 2007 año
105.085
+0.34
0.32%
1 ene 2008 año
105.447
+0.361
0.34%
1 ene 2009 año
105.327
-0.119
-0.11%
Ranking de los países por los datos estadísticos actuales


Comentarios: