29
/es/
es
AIzaSyAYiBZKx7MnpbEhh9jyipgxe19OcubqV5w
April 1, 2024
163497
Japan
JPN
true
2
1
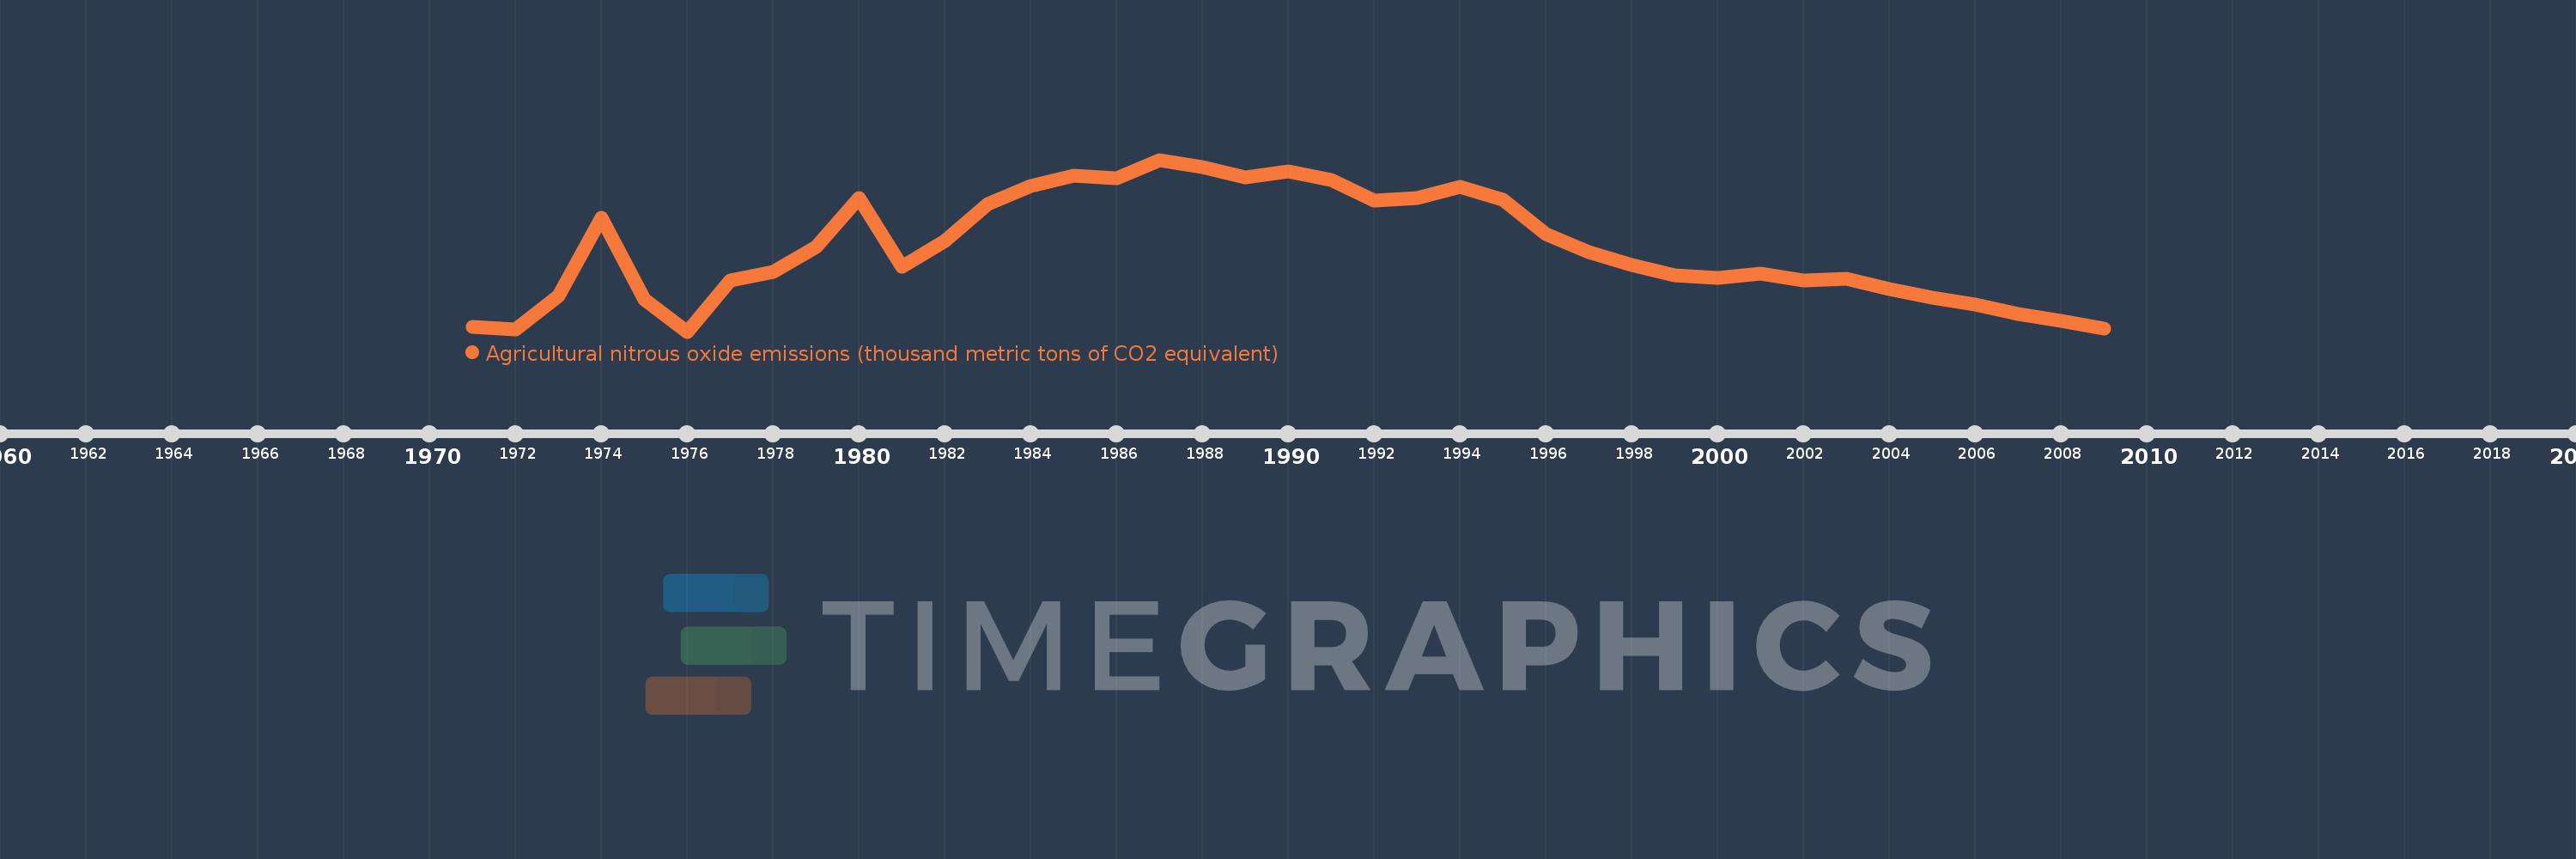
Agricultural nitrous oxide emissions (thousand metric tons of CO2 equivalent)
2009,2008,2007,2006,2005,2004,2003,2002,2001,2000,1999,1998,1997,1996,1995,1994,1993,1992,1991,1990,1989,1988,1987,1986,1985,1984,1983,1982,1981,1980,1979,1978,1977,1976,1975,1974,1973,1972,1971
Estas estadísticas en otros países:
AfghanistanAlbaniaAlgeriaAmerican SamoaAndorraAngolaAntigua and BarbudaArab WorldArgentinaArmeniaArubaAustraliaAustriaAzerbaijanBahamas, TheBahrainBangladeshBarbadosBelarusBelgiumBelizeBeninBermudaBhutanBoliviaBosnia and HerzegovinaBotswanaBrazilBritish Virgin IslandsBrunei DarussalamBulgariaBurkina FasoBurundiCabo VerdeCambodiaCameroonCanadaCaribbean small statesCayman IslandsCentral African RepublicCentral Europe and the BalticsChadChannel IslandsChileChinaColombiaComorosCongo, Dem. Rep.Congo, Rep.Costa RicaCote d'IvoireCroatiaCubaCuracaoCyprusCzech RepublicDenmarkDjiboutiDominicaDominican RepublicEarly-demographic dividendEast Asia & PacificEast Asia & Pacific (excluding high income)East Asia & Pacific (IDA & IBRD countries)EcuadorEgypt, Arab Rep.El SalvadorEquatorial GuineaEritreaEstoniaEthiopiaEuro areaEurope & Central AsiaEurope & Central Asia (excluding high income)Europe & Central Asia (IDA & IBRD countries)European UnionFaroe IslandsFijiFinlandFragile and conflict affected situationsFranceFrench PolynesiaGabonGambia, TheGeorgiaGermanyGhanaGibraltarGreeceGreenlandGrenadaGuamGuatemalaGuineaGuinea-BissauGuyanaHaitiHeavily indebted poor countries (HIPC)High incomeHondurasHong Kong SAR, ChinaHungaryIBRD onlyIcelandIDA & IBRD totalIDA blendIDA onlyIDA totalIndiaIndonesiaIran, Islamic Rep.IraqIrelandIsle of ManIsraelItalyJamaicaJapanJordanKazakhstanKenyaKiribatiKorea, Dem. People’s Rep.Korea, Rep.KosovoKuwaitKyrgyz RepublicLao PDRLate-demographic dividendLatin America & Caribbean Latin America & Caribbean (excluding high income)Latin America & the Caribbean (IDA & IBRD countries)LatviaLeast developed countries: UN classificationLebanonLesothoLiberiaLibyaLiechtensteinLithuaniaLow & middle incomeLow incomeLower middle incomeLuxembourgMacao SAR, ChinaMacedonia, FYRMadagascarMalawiMalaysiaMaldivesMaliMaltaMarshall IslandsMauritaniaMauritiusMexicoMicronesia, Fed. Sts.Middle East & North AfricaMiddle East & North Africa (excluding high income)Middle East & North Africa (IDA & IBRD countries)Middle incomeMoldovaMonacoMongoliaMontenegroMoroccoMozambiqueMyanmarNamibiaNauruNepalNetherlandsNew CaledoniaNew ZealandNicaraguaNigerNigeriaNorth AmericaNorthern Mariana IslandsNorwayOECD membersOmanOther small statesPacific island small statesPakistanPalauPanamaPapua New GuineaParaguayPeruPhilippinesPolandPortugalPost-demographic dividendPre-demographic dividendPuerto RicoQatarRomaniaRussian FederationRwandaSamoaSan MarinoSao Tome and PrincipeSaudi ArabiaSenegalSerbiaSeychellesSierra LeoneSingaporeSint Maarten (Dutch part)Slovak RepublicSloveniaSmall statesSolomon IslandsSomaliaSouth AfricaSouth AsiaSouth Asia (IDA & IBRD)South SudanSpainSri LankaSt. Kitts and NevisSt. LuciaSt. Martin (French part)St. Vincent and the GrenadinesSub-Saharan Africa Sub-Saharan Africa (excluding high income)Sub-Saharan Africa (IDA & IBRD countries)SudanSurinameSwazilandSwedenSwitzerlandSyrian Arab RepublicTajikistanTanzaniaThailandTimor-LesteTogoTongaTrinidad and TobagoTunisiaTurkeyTurkmenistanTurks and Caicos IslandsTuvaluUgandaUkraineUnited Arab EmiratesUnited KingdomUnited StatesUpper middle incomeUruguayUzbekistanVanuatuVenezuela, RBVietnamVirgin Islands (U.S.)West Bank and GazaWorldYemen, Rep.ZambiaZimbabwe línea de tiempo (timeline):
En esta escala de tiempo se presenta un gráfico de 1971 y 2009 de Japan. Los datos de 1970 están ausentes. El número de observaciones reales por fecha: 39.
Fuente (nombre):
Indicadores del desarrollo mundial
Fuente (organización):
European Commission, Joint Research Centre (JRC)/Netherlands Environmental Assessment Agency (PBL). Emission Database for Global Atmospheric Research (EDGAR): http://edgar.jrc.ec.europa.eu/
Categorías:
Agriculture & Rural Development, Environment
Se ha actualizado:
23 abr 2017 año
Los indicadores de los cambios de valor en los últimos años
Mínimo:
8.03 mil
1 ene 1976 año
Máximo:
9.928 mil
1 ene 1987 año
A la fecha de observación
Valor
Cambio absoluto
El cambio con respecto al valor anterior
1 ene 1971 año
8.081 mil
+8.081 mil
0.0%
1 ene 1972 año
8.052 mil
-29.022
-0.36%
1 ene 1973 año
8.423 mil
+370.271
4.6%
1 ene 1974 año
9.286 mil
+863.412
10.25%
1 ene 1975 año
8.388 mil
-898.284
-9.67%
1 ene 1976 año
8.03 mil
-357.766
-4.27%
1 ene 1977 año
8.594 mil
+563.706
7.02%
1 ene 1978 año
8.689 mil
+95.479
1.11%
1 ene 1979 año
8.967 mil
+278.363
3.2%
1 ene 1980 año
9.502 mil
+534.689
5.96%
1 ene 1981 año
8.742 mil
-760.026
-8.0%
1 ene 1982 año
9.028 mil
+285.871
3.27%
1 ene 1983 año
9.442 mil
+413.907
4.58%
1 ene 1984 año
9.637 mil
+195.499
2.07%
1 ene 1985 año
9.756 mil
+118.973
1.23%
1 ene 1986 año
9.726 mil
-29.981
-0.31%
1 ene 1987 año
9.928 mil
+201.944
2.08%
1 ene 1988 año
9.843 mil
-85.227
-0.86%
1 ene 1989 año
9.735 mil
-107.751
-1.09%
1 ene 1990 año
9.8 mil
+64.241
0.66%
1 ene 1991 año
9.709 mil
-90.803
-0.93%
1 ene 1992 año
9.479 mil
-229.277
-2.36%
1 ene 1993 año
9.505 mil
+25.073
0.26%
1 ene 1994 año
9.632 mil
+127.365
1.34%
1 ene 1995 año
9.488 mil
-143.738
-1.49%
1 ene 1996 año
9.103 mil
-384.795
-4.06%
1 ene 1997 año
8.906 mil
-197.331
-2.17%
1 ene 1998 año
8.761 mil
-144.853
-1.63%
1 ene 1999 año
8.647 mil
-114.302
-1.3%
1 ene 2000 año
8.626 mil
-20.895
-0.24%
1 ene 2001 año
8.667 mil
+41.2
0.48%
1 ene 2002 año
8.599 mil
-68.054
-0.79%
1 ene 2003 año
8.61 mil
+11.011
0.13%
1 ene 2004 año
8.496 mil
-114.245
-1.33%
1 ene 2005 año
8.406 mil
-89.509
-1.05%
1 ene 2006 año
8.325 mil
-81.674
-0.97%
1 ene 2007 año
8.228 mil
-96.425
-1.16%
1 ene 2008 año
8.147 mil
-80.97
-0.98%
1 ene 2009 año
8.064 mil
-83.657
-1.03%
Ranking de los países por los datos estadísticos actuales


Comentarios: