29
/es/
es
AIzaSyAYiBZKx7MnpbEhh9jyipgxe19OcubqV5w
April 1, 2024
131371
Faroe Islands
FRO
true
2
1
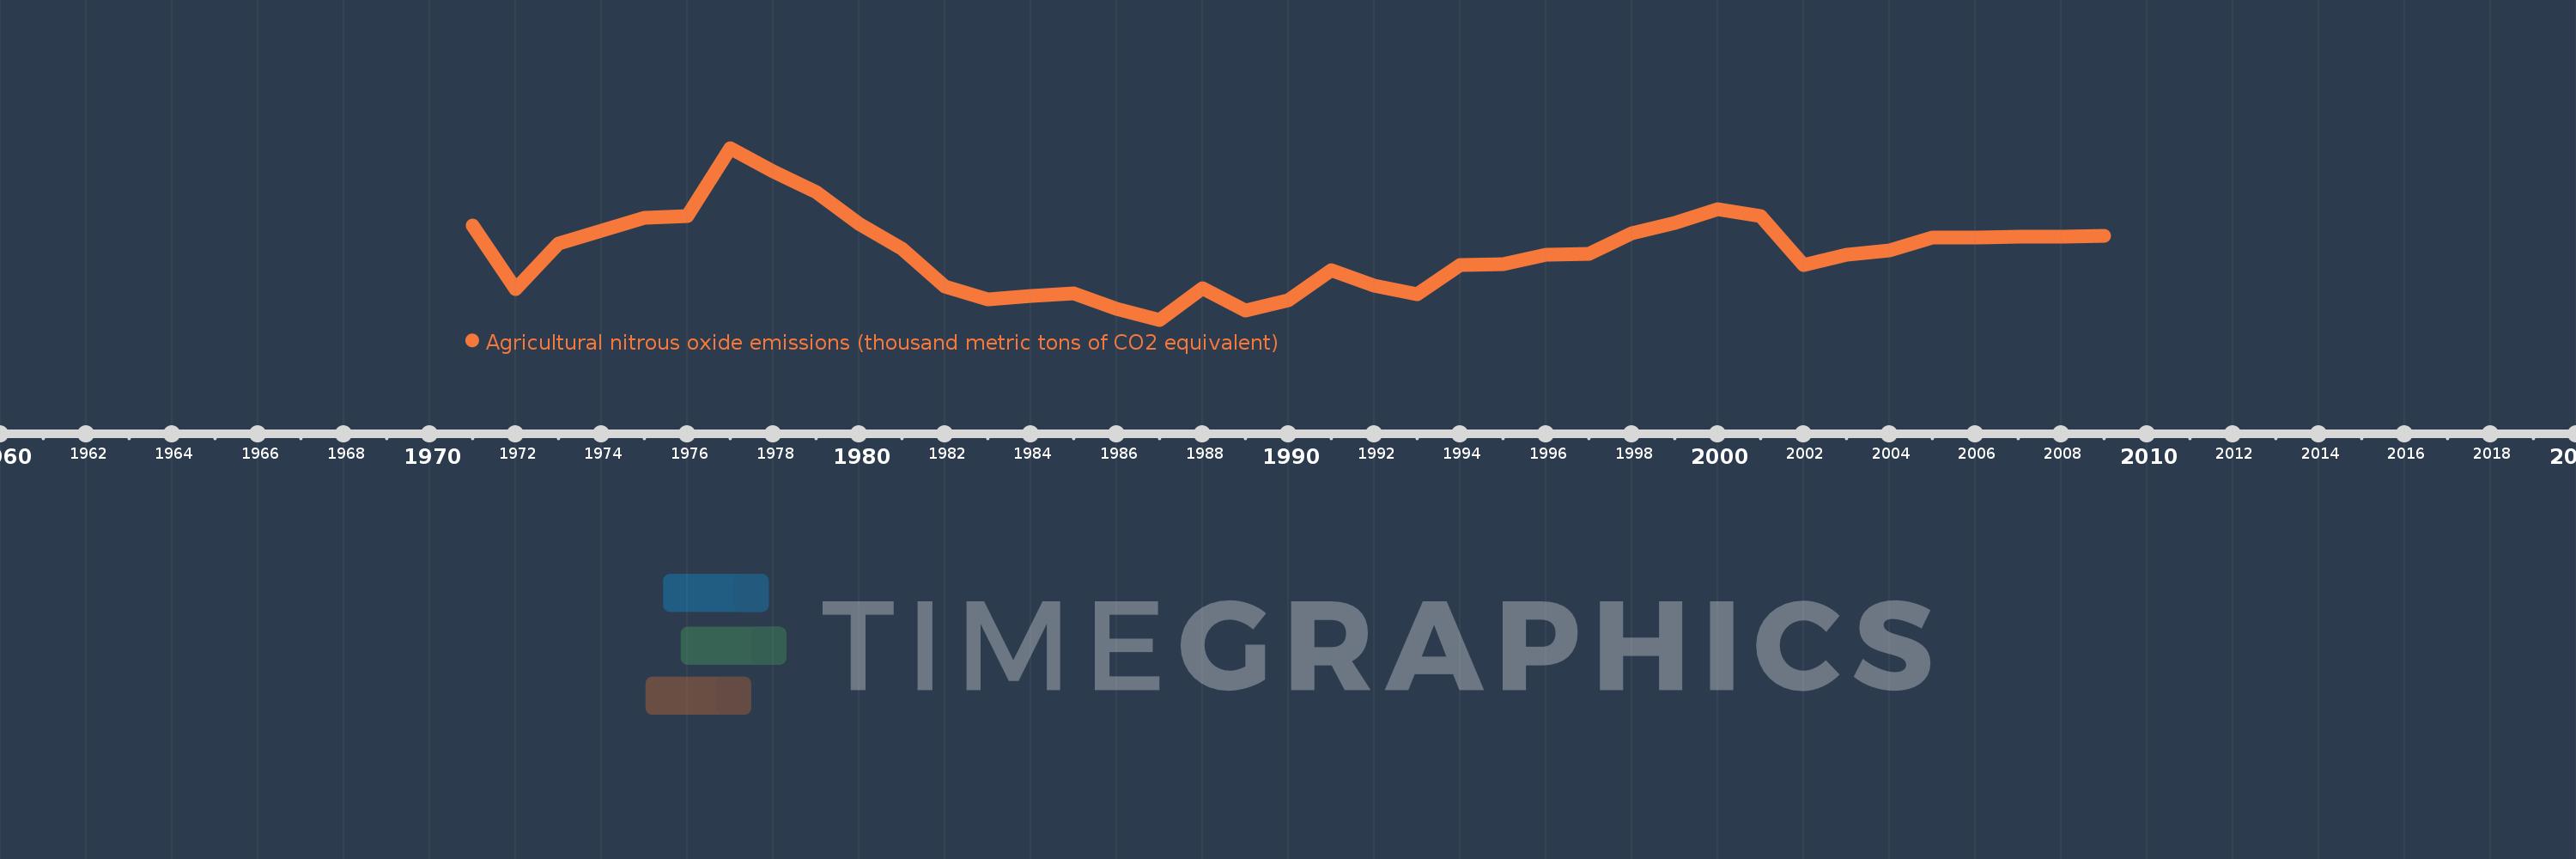
Agricultural nitrous oxide emissions (thousand metric tons of CO2 equivalent)
2009,2008,2007,2006,2005,2004,2003,2002,2001,2000,1999,1998,1997,1996,1995,1994,1993,1992,1991,1990,1989,1988,1987,1986,1985,1984,1983,1982,1981,1980,1979,1978,1977,1976,1975,1974,1973,1972,1971
Estas estadísticas en otros países:
AfghanistanAlbaniaAlgeriaAmerican SamoaAndorraAngolaAntigua and BarbudaArab WorldArgentinaArmeniaArubaAustraliaAustriaAzerbaijanBahamas, TheBahrainBangladeshBarbadosBelarusBelgiumBelizeBeninBermudaBhutanBoliviaBosnia and HerzegovinaBotswanaBrazilBritish Virgin IslandsBrunei DarussalamBulgariaBurkina FasoBurundiCabo VerdeCambodiaCameroonCanadaCaribbean small statesCayman IslandsCentral African RepublicCentral Europe and the BalticsChadChannel IslandsChileChinaColombiaComorosCongo, Dem. Rep.Congo, Rep.Costa RicaCote d'IvoireCroatiaCubaCuracaoCyprusCzech RepublicDenmarkDjiboutiDominicaDominican RepublicEarly-demographic dividendEast Asia & PacificEast Asia & Pacific (excluding high income)East Asia & Pacific (IDA & IBRD countries)EcuadorEgypt, Arab Rep.El SalvadorEquatorial GuineaEritreaEstoniaEthiopiaEuro areaEurope & Central AsiaEurope & Central Asia (excluding high income)Europe & Central Asia (IDA & IBRD countries)European UnionFaroe IslandsFijiFinlandFragile and conflict affected situationsFranceFrench PolynesiaGabonGambia, TheGeorgiaGermanyGhanaGibraltarGreeceGreenlandGrenadaGuamGuatemalaGuineaGuinea-BissauGuyanaHaitiHeavily indebted poor countries (HIPC)High incomeHondurasHong Kong SAR, ChinaHungaryIBRD onlyIcelandIDA & IBRD totalIDA blendIDA onlyIDA totalIndiaIndonesiaIran, Islamic Rep.IraqIrelandIsle of ManIsraelItalyJamaicaJapanJordanKazakhstanKenyaKiribatiKorea, Dem. People’s Rep.Korea, Rep.KosovoKuwaitKyrgyz RepublicLao PDRLate-demographic dividendLatin America & Caribbean Latin America & Caribbean (excluding high income)Latin America & the Caribbean (IDA & IBRD countries)LatviaLeast developed countries: UN classificationLebanonLesothoLiberiaLibyaLiechtensteinLithuaniaLow & middle incomeLow incomeLower middle incomeLuxembourgMacao SAR, ChinaMacedonia, FYRMadagascarMalawiMalaysiaMaldivesMaliMaltaMarshall IslandsMauritaniaMauritiusMexicoMicronesia, Fed. Sts.Middle East & North AfricaMiddle East & North Africa (excluding high income)Middle East & North Africa (IDA & IBRD countries)Middle incomeMoldovaMonacoMongoliaMontenegroMoroccoMozambiqueMyanmarNamibiaNauruNepalNetherlandsNew CaledoniaNew ZealandNicaraguaNigerNigeriaNorth AmericaNorthern Mariana IslandsNorwayOECD membersOmanOther small statesPacific island small statesPakistanPalauPanamaPapua New GuineaParaguayPeruPhilippinesPolandPortugalPost-demographic dividendPre-demographic dividendPuerto RicoQatarRomaniaRussian FederationRwandaSamoaSan MarinoSao Tome and PrincipeSaudi ArabiaSenegalSerbiaSeychellesSierra LeoneSingaporeSint Maarten (Dutch part)Slovak RepublicSloveniaSmall statesSolomon IslandsSomaliaSouth AfricaSouth AsiaSouth Asia (IDA & IBRD)South SudanSpainSri LankaSt. Kitts and NevisSt. LuciaSt. Martin (French part)St. Vincent and the GrenadinesSub-Saharan Africa Sub-Saharan Africa (excluding high income)Sub-Saharan Africa (IDA & IBRD countries)SudanSurinameSwazilandSwedenSwitzerlandSyrian Arab RepublicTajikistanTanzaniaThailandTimor-LesteTogoTongaTrinidad and TobagoTunisiaTurkeyTurkmenistanTurks and Caicos IslandsTuvaluUgandaUkraineUnited Arab EmiratesUnited KingdomUnited StatesUpper middle incomeUruguayUzbekistanVanuatuVenezuela, RBVietnamVirgin Islands (U.S.)West Bank and GazaWorldYemen, Rep.ZambiaZimbabwe línea de tiempo (timeline):
En esta escala de tiempo se presenta un gráfico de 1971 y 2009 de Faroe Islands. Los datos de 1970 están ausentes. El número de observaciones reales por fecha: 39.
Fuente (nombre):
Indicadores del desarrollo mundial
Fuente (organización):
European Commission, Joint Research Centre (JRC)/Netherlands Environmental Assessment Agency (PBL). Emission Database for Global Atmospheric Research (EDGAR): http://edgar.jrc.ec.europa.eu/
Categorías:
Agriculture & Rural Development, Environment
Se ha actualizado:
23 abr 2017 año
Los indicadores de los cambios de valor en los últimos años
Mínimo:
5.362
1 ene 1987 año
Máximo:
6.072
1 ene 1977 año
A la fecha de observación
Valor
Cambio absoluto
El cambio con respecto al valor anterior
1 ene 1971 año
5.752
+5.752
0.0%
1 ene 1972 año
5.487
-0.265
-4.6%
1 ene 1973 año
5.676
+0.189
3.44%
1 ene 1974 año
5.73
+0.055
0.96%
1 ene 1975 año
5.782
+0.052
0.9%
1 ene 1976 año
5.791
+0.009
0.15%
1 ene 1977 año
6.072
+0.281
4.86%
1 ene 1978 año
5.975
-0.097
-1.6%
1 ene 1979 año
5.891
-0.084
-1.4%
1 ene 1980 año
5.758
-0.134
-2.27%
1 ene 1981 año
5.656
-0.102
-1.77%
1 ene 1982 año
5.499
-0.157
-2.77%
1 ene 1983 año
5.447
-0.052
-0.95%
1 ene 1984 año
5.46
+0.013
0.24%
1 ene 1985 año
5.471
+0.011
0.2%
1 ene 1986 año
5.406
-0.065
-1.18%
1 ene 1987 año
5.362
-0.043
-0.8%
1 ene 1988 año
5.492
+0.13
2.42%
1 ene 1989 año
5.399
-0.092
-1.68%
1 ene 1990 año
5.444
+0.045
0.83%
1 ene 1991 año
5.567
+0.123
2.26%
1 ene 1992 año
5.502
-0.065
-1.17%
1 ene 1993 año
5.469
-0.033
-0.6%
1 ene 1994 año
5.588
+0.119
2.17%
1 ene 1995 año
5.59
+0.002
0.03%
1 ene 1996 año
5.631
+0.042
0.74%
1 ene 1997 año
5.633
+0.002
0.04%
1 ene 1998 año
5.719
+0.086
1.53%
1 ene 1999 año
5.762
+0.043
0.75%
1 ene 2000 año
5.819
+0.057
0.98%
1 ene 2001 año
5.791
-0.027
-0.47%
1 ene 2002 año
5.588
-0.204
-3.52%
1 ene 2003 año
5.632
+0.045
0.8%
1 ene 2004 año
5.647
+0.015
0.27%
1 ene 2005 año
5.703
+0.055
0.98%
1 ene 2006 año
5.703
0.0
0.0%
1 ene 2007 año
5.706
+0.003
0.06%
1 ene 2008 año
5.706
+0.0
0.01%
1 ene 2009 año
5.709
+0.003
0.04%
Ranking de los países por los datos estadísticos actuales


Comentarios: