29
/es/
es
AIzaSyAYiBZKx7MnpbEhh9jyipgxe19OcubqV5w
April 1, 2024
80173
Belarus
BLR
true
2
1
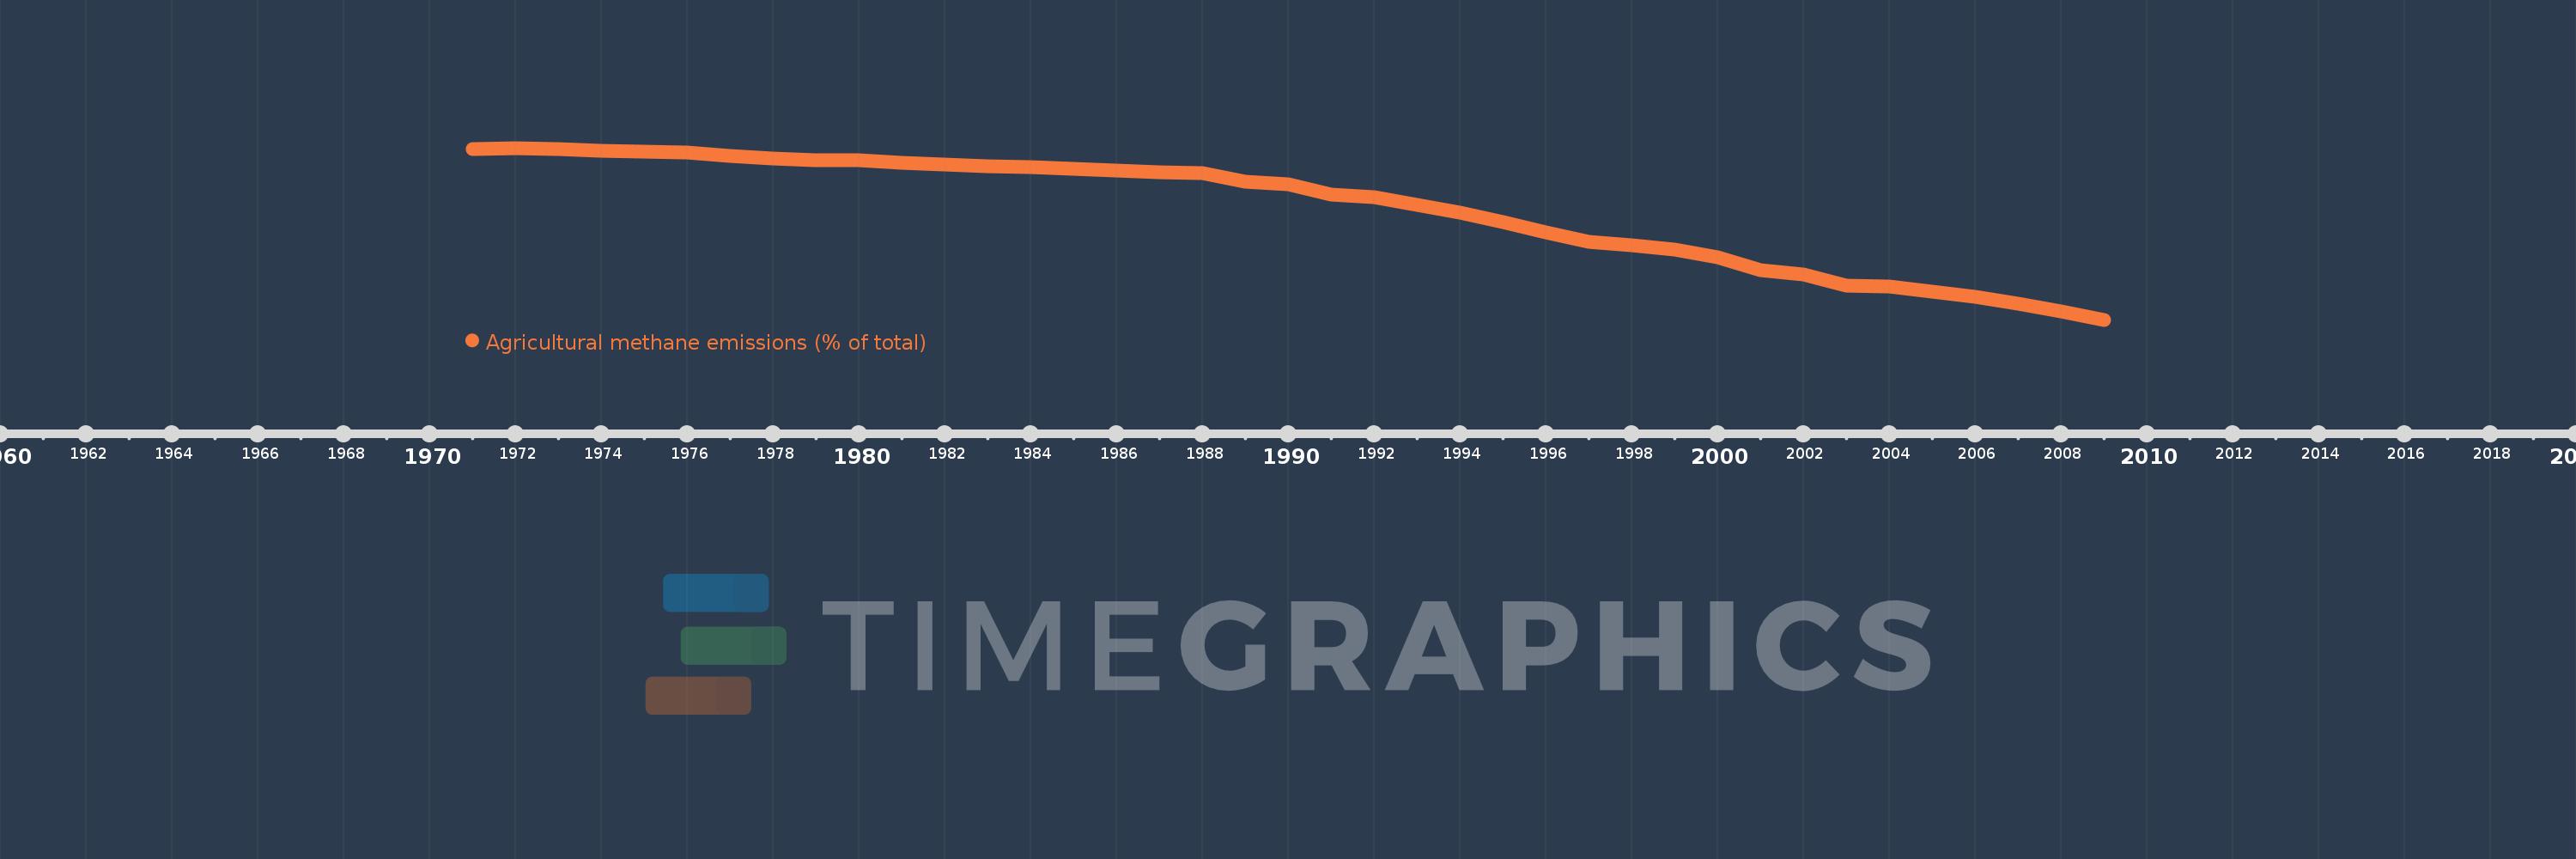
Agricultural methane emissions (% of total)
2009,2008,2007,2006,2005,2004,2003,2002,2001,2000,1999,1998,1997,1996,1995,1994,1993,1992,1991,1990,1989,1988,1987,1986,1985,1984,1983,1982,1981,1980,1979,1978,1977,1976,1975,1974,1973,1972,1971
Estas estadísticas en otros países:
AfghanistanAlbaniaAlgeriaAmerican SamoaAngolaAntigua and BarbudaArab WorldArgentinaArmeniaArubaAustraliaAustriaAzerbaijanBahamas, TheBahrainBangladeshBarbadosBelarusBelgiumBelizeBeninBermudaBhutanBoliviaBosnia and HerzegovinaBotswanaBrazilBritish Virgin IslandsBrunei DarussalamBulgariaBurkina FasoBurundiCabo VerdeCambodiaCameroonCanadaCaribbean small statesCayman IslandsCentral African RepublicCentral Europe and the BalticsChadChileChinaColombiaComorosCongo, Dem. Rep.Congo, Rep.Costa RicaCote d'IvoireCroatiaCubaCyprusCzech RepublicDenmarkDjiboutiDominicaDominican RepublicEarly-demographic dividendEast Asia & PacificEast Asia & Pacific (excluding high income)East Asia & Pacific (IDA & IBRD countries)EcuadorEgypt, Arab Rep.El SalvadorEquatorial GuineaEritreaEstoniaEthiopiaEuro areaEurope & Central AsiaEurope & Central Asia (excluding high income)Europe & Central Asia (IDA & IBRD countries)European UnionFaroe IslandsFijiFinlandFragile and conflict affected situationsFranceFrench PolynesiaGabonGambia, TheGeorgiaGermanyGhanaGibraltarGreeceGreenlandGrenadaGuamGuatemalaGuineaGuinea-BissauGuyanaHaitiHeavily indebted poor countries (HIPC)High incomeHondurasHong Kong SAR, ChinaHungaryIBRD onlyIcelandIDA & IBRD totalIDA blendIDA onlyIDA totalIndiaIndonesiaIran, Islamic Rep.IraqIrelandIsraelItalyJamaicaJapanJordanKazakhstanKenyaKiribatiKorea, Dem. People’s Rep.Korea, Rep.KuwaitKyrgyz RepublicLao PDRLate-demographic dividendLatin America & Caribbean Latin America & Caribbean (excluding high income)Latin America & the Caribbean (IDA & IBRD countries)LatviaLeast developed countries: UN classificationLebanonLesothoLiberiaLibyaLithuaniaLow & middle incomeLow incomeLower middle incomeLuxembourgMacao SAR, ChinaMacedonia, FYRMadagascarMalawiMalaysiaMaldivesMaliMaltaMarshall IslandsMauritaniaMauritiusMexicoMicronesia, Fed. Sts.Middle East & North AfricaMiddle East & North Africa (excluding high income)Middle East & North Africa (IDA & IBRD countries)Middle incomeMoldovaMongoliaMoroccoMozambiqueMyanmarNamibiaNauruNepalNetherlandsNew CaledoniaNew ZealandNicaraguaNigerNigeriaNorth AmericaNorthern Mariana IslandsNorwayOECD membersOmanOther small statesPacific island small statesPakistanPalauPanamaPapua New GuineaParaguayPeruPhilippinesPolandPortugalPost-demographic dividendPre-demographic dividendPuerto RicoQatarRomaniaRussian FederationRwandaSamoaSao Tome and PrincipeSaudi ArabiaSenegalSerbiaSeychellesSierra LeoneSingaporeSlovak RepublicSloveniaSmall statesSolomon IslandsSomaliaSouth AfricaSouth AsiaSouth Asia (IDA & IBRD)SpainSri LankaSt. Kitts and NevisSt. LuciaSt. Vincent and the GrenadinesSub-Saharan Africa Sub-Saharan Africa (excluding high income)Sub-Saharan Africa (IDA & IBRD countries)SudanSurinameSwazilandSwedenSwitzerlandSyrian Arab RepublicTajikistanTanzaniaThailandTimor-LesteTogoTongaTrinidad and TobagoTunisiaTurkeyTurkmenistanTurks and Caicos IslandsTuvaluUgandaUkraineUnited Arab EmiratesUnited KingdomUnited StatesUpper middle incomeUruguayUzbekistanVanuatuVenezuela, RBVietnamVirgin Islands (U.S.)WorldYemen, Rep.ZambiaZimbabwe línea de tiempo (timeline):
En esta escala de tiempo se presenta un gráfico de 1971 y 2009 de Belarus. Los datos de 1970 están ausentes. El número de observaciones reales por fecha: 39.
Fuente (nombre):
Indicadores del desarrollo mundial
Fuente (organización):
World Bank staff estimates from original source: European Commission, Joint Research Centre (JRC)/Netherlands Environmental Assessment Agency (PBL). Emission Database for Global Atmospheric Research (EDGAR): http://edgar.jrc.ec.europa.eu/.
Categorías:
Agriculture & Rural Development, Environment
Se ha actualizado:
23 abr 2017 año
Los indicadores de los cambios de valor en los últimos años
Mínimo:
53.787
1 ene 2009 año
Máximo:
84.997
1 ene 1972 año
A la fecha de observación
Valor
Cambio absoluto
El cambio con respecto al valor anterior
1 ene 1971 año
84.813
+84.813
0.0%
1 ene 1972 año
84.997
+0.184
0.22%
1 ene 1973 año
84.828
-0.169
-0.2%
1 ene 1974 año
84.518
-0.31
-0.37%
1 ene 1975 año
84.327
-0.191
-0.23%
1 ene 1976 año
84.15
-0.177
-0.21%
1 ene 1977 año
83.585
-0.565
-0.67%
1 ene 1978 año
83.107
-0.478
-0.57%
1 ene 1979 año
82.843
-0.264
-0.32%
1 ene 1980 año
82.714
-0.129
-0.16%
1 ene 1981 año
82.331
-0.383
-0.46%
1 ene 1982 año
81.942
-0.389
-0.47%
1 ene 1983 año
81.654
-0.287
-0.35%
1 ene 1984 año
81.44
-0.215
-0.26%
1 ene 1985 año
81.222
-0.218
-0.27%
1 ene 1986 año
80.942
-0.28
-0.34%
1 ene 1987 año
80.566
-0.376
-0.46%
1 ene 1988 año
80.424
-0.142
-0.18%
1 ene 1989 año
78.86
-1.563
-1.94%
1 ene 1990 año
78.375
-0.486
-0.62%
1 ene 1991 año
76.529
-1.845
-2.35%
1 ene 1992 año
76.04
-0.489
-0.64%
1 ene 1993 año
74.618
-1.422
-1.87%
1 ene 1994 año
73.251
-1.367
-1.83%
1 ene 1995 año
71.508
-1.743
-2.38%
1 ene 1996 año
69.601
-1.907
-2.67%
1 ene 1997 año
67.94
-1.661
-2.39%
1 ene 1998 año
67.381
-0.559
-0.82%
1 ene 1999 año
66.606
-0.775
-1.15%
1 ene 2000 año
65.188
-1.418
-2.13%
1 ene 2001 año
62.763
-2.425
-3.72%
1 ene 2002 año
61.964
-0.799
-1.27%
1 ene 2003 año
60.022
-1.942
-3.13%
1 ene 2004 año
59.904
-0.118
-0.2%
1 ene 2005 año
58.892
-1.012
-1.69%
1 ene 2006 año
58.016
-0.877
-1.49%
1 ene 2007 año
56.732
-1.284
-2.21%
1 ene 2008 año
55.292
-1.44
-2.54%
1 ene 2009 año
53.787
-1.505
-2.72%
Ranking de los países por los datos estadísticos actuales


Comentarios: