29
/es/
es
AIzaSyAYiBZKx7MnpbEhh9jyipgxe19OcubqV5w
April 1, 2024
279492
Vanuatu
VUT
true
2
1
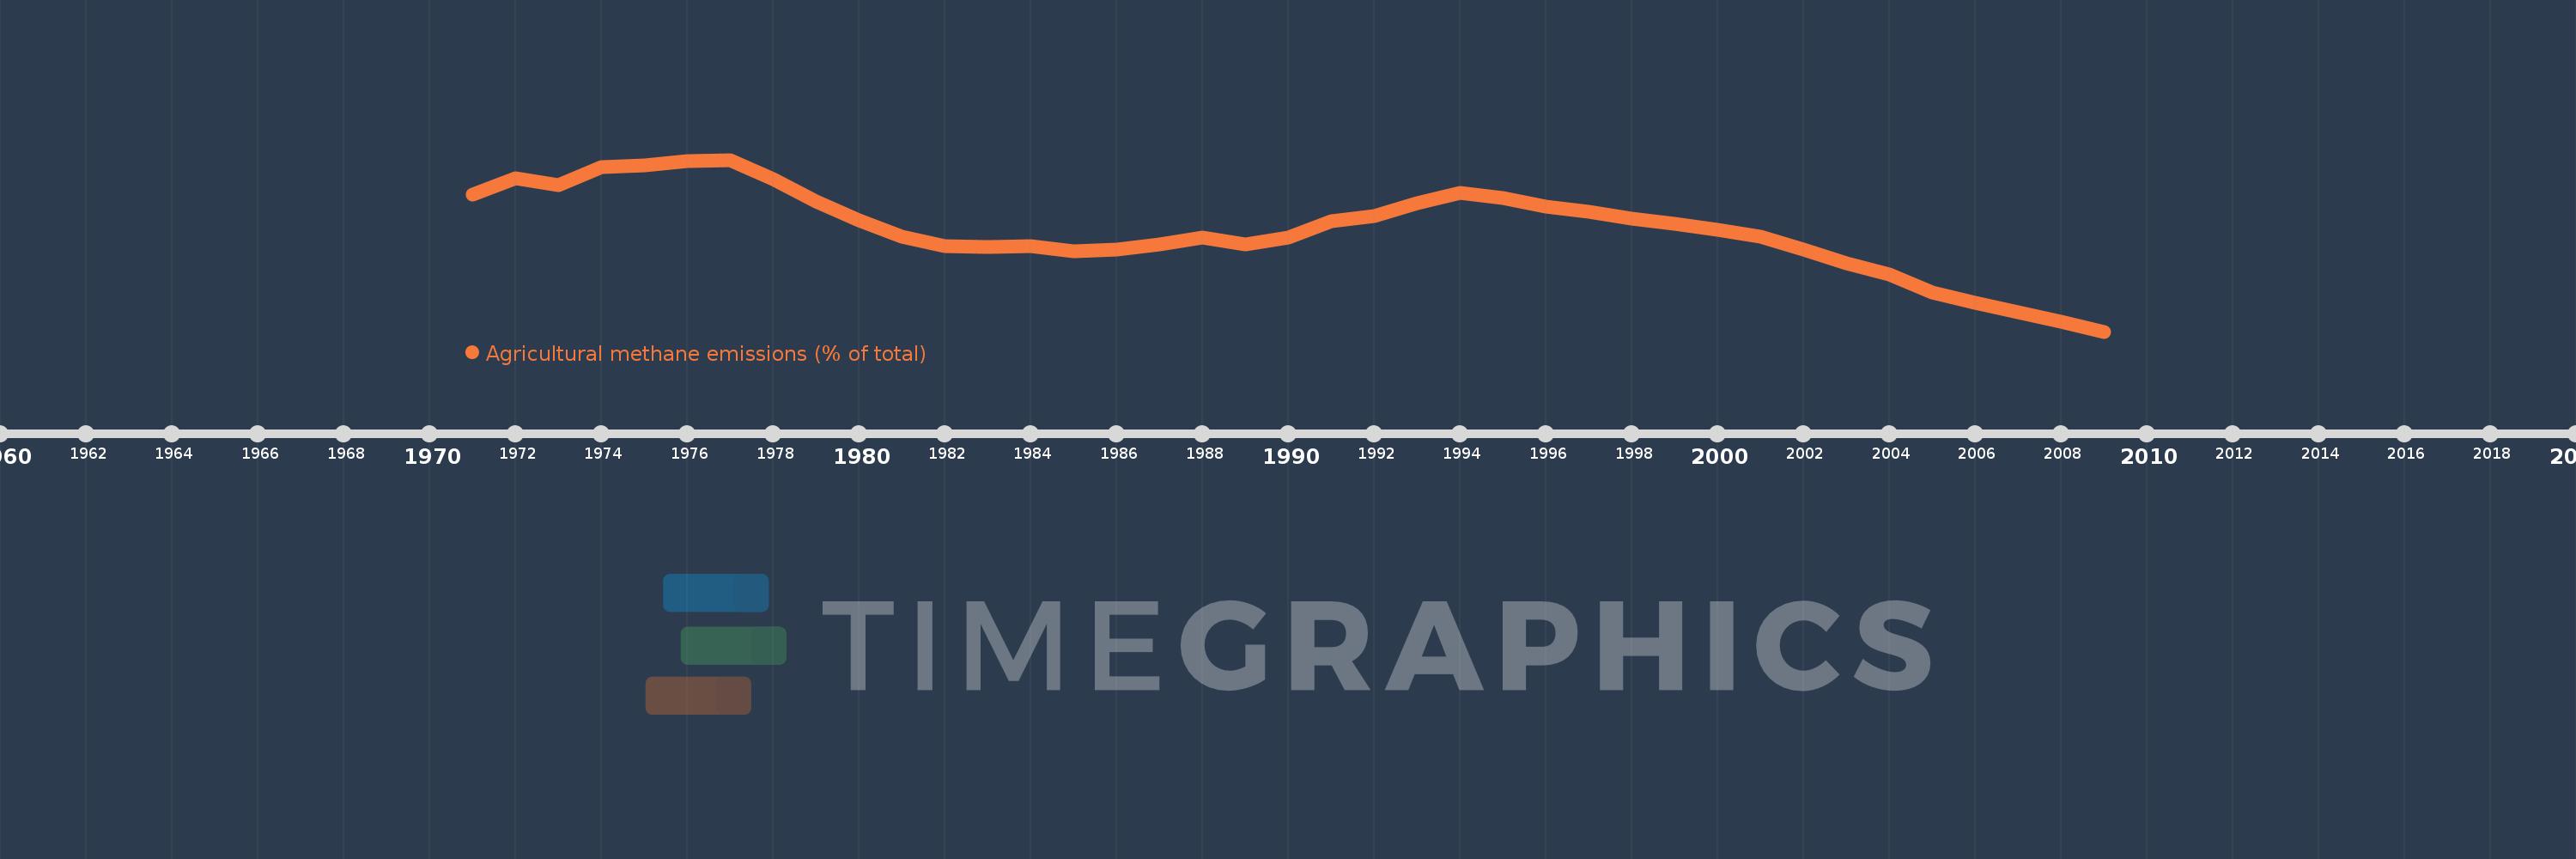
Agricultural methane emissions (% of total)
2009,2008,2007,2006,2005,2004,2003,2002,2001,2000,1999,1998,1997,1996,1995,1994,1993,1992,1991,1990,1989,1988,1987,1986,1985,1984,1983,1982,1981,1980,1979,1978,1977,1976,1975,1974,1973,1972,1971
Estas estadísticas en otros países:
AfghanistanAlbaniaAlgeriaAmerican SamoaAngolaAntigua and BarbudaArab WorldArgentinaArmeniaArubaAustraliaAustriaAzerbaijanBahamas, TheBahrainBangladeshBarbadosBelarusBelgiumBelizeBeninBermudaBhutanBoliviaBosnia and HerzegovinaBotswanaBrazilBritish Virgin IslandsBrunei DarussalamBulgariaBurkina FasoBurundiCabo VerdeCambodiaCameroonCanadaCaribbean small statesCayman IslandsCentral African RepublicCentral Europe and the BalticsChadChileChinaColombiaComorosCongo, Dem. Rep.Congo, Rep.Costa RicaCote d'IvoireCroatiaCubaCyprusCzech RepublicDenmarkDjiboutiDominicaDominican RepublicEarly-demographic dividendEast Asia & PacificEast Asia & Pacific (excluding high income)East Asia & Pacific (IDA & IBRD countries)EcuadorEgypt, Arab Rep.El SalvadorEquatorial GuineaEritreaEstoniaEthiopiaEuro areaEurope & Central AsiaEurope & Central Asia (excluding high income)Europe & Central Asia (IDA & IBRD countries)European UnionFaroe IslandsFijiFinlandFragile and conflict affected situationsFranceFrench PolynesiaGabonGambia, TheGeorgiaGermanyGhanaGibraltarGreeceGreenlandGrenadaGuamGuatemalaGuineaGuinea-BissauGuyanaHaitiHeavily indebted poor countries (HIPC)High incomeHondurasHong Kong SAR, ChinaHungaryIBRD onlyIcelandIDA & IBRD totalIDA blendIDA onlyIDA totalIndiaIndonesiaIran, Islamic Rep.IraqIrelandIsraelItalyJamaicaJapanJordanKazakhstanKenyaKiribatiKorea, Dem. People’s Rep.Korea, Rep.KuwaitKyrgyz RepublicLao PDRLate-demographic dividendLatin America & Caribbean Latin America & Caribbean (excluding high income)Latin America & the Caribbean (IDA & IBRD countries)LatviaLeast developed countries: UN classificationLebanonLesothoLiberiaLibyaLithuaniaLow & middle incomeLow incomeLower middle incomeLuxembourgMacao SAR, ChinaMacedonia, FYRMadagascarMalawiMalaysiaMaldivesMaliMaltaMarshall IslandsMauritaniaMauritiusMexicoMicronesia, Fed. Sts.Middle East & North AfricaMiddle East & North Africa (excluding high income)Middle East & North Africa (IDA & IBRD countries)Middle incomeMoldovaMongoliaMoroccoMozambiqueMyanmarNamibiaNauruNepalNetherlandsNew CaledoniaNew ZealandNicaraguaNigerNigeriaNorth AmericaNorthern Mariana IslandsNorwayOECD membersOmanOther small statesPacific island small statesPakistanPalauPanamaPapua New GuineaParaguayPeruPhilippinesPolandPortugalPost-demographic dividendPre-demographic dividendPuerto RicoQatarRomaniaRussian FederationRwandaSamoaSao Tome and PrincipeSaudi ArabiaSenegalSerbiaSeychellesSierra LeoneSingaporeSlovak RepublicSloveniaSmall statesSolomon IslandsSomaliaSouth AfricaSouth AsiaSouth Asia (IDA & IBRD)SpainSri LankaSt. Kitts and NevisSt. LuciaSt. Vincent and the GrenadinesSub-Saharan Africa Sub-Saharan Africa (excluding high income)Sub-Saharan Africa (IDA & IBRD countries)SudanSurinameSwazilandSwedenSwitzerlandSyrian Arab RepublicTajikistanTanzaniaThailandTimor-LesteTogoTongaTrinidad and TobagoTunisiaTurkeyTurkmenistanTurks and Caicos IslandsTuvaluUgandaUkraineUnited Arab EmiratesUnited KingdomUnited StatesUpper middle incomeUruguayUzbekistanVanuatuVenezuela, RBVietnamVirgin Islands (U.S.)WorldYemen, Rep.ZambiaZimbabwe línea de tiempo (timeline):
En esta escala de tiempo se presenta un gráfico de 1971 y 2009 de Vanuatu. Los datos de 1970 están ausentes. El número de observaciones reales por fecha: 39.
Fuente (nombre):
Indicadores del desarrollo mundial
Fuente (organización):
World Bank staff estimates from original source: European Commission, Joint Research Centre (JRC)/Netherlands Environmental Assessment Agency (PBL). Emission Database for Global Atmospheric Research (EDGAR): http://edgar.jrc.ec.europa.eu/.
Categorías:
Agriculture & Rural Development, Environment
Se ha actualizado:
23 abr 2017 año
Los indicadores de los cambios de valor en los últimos años
Mínimo:
85.384
1 ene 2009 año
Máximo:
90.888
1 ene 1977 año
A la fecha de observación
Valor
Cambio absoluto
El cambio con respecto al valor anterior
1 ene 1971 año
89.785
+89.785
0.0%
1 ene 1972 año
90.31
+0.526
0.59%
1 ene 1973 año
90.087
-0.224
-0.25%
1 ene 1974 año
90.653
+0.567
0.63%
1 ene 1975 año
90.716
+0.062
0.07%
1 ene 1976 año
90.836
+0.12
0.13%
1 ene 1977 año
90.888
+0.052
0.06%
1 ene 1978 año
90.261
-0.627
-0.69%
1 ene 1979 año
89.557
-0.705
-0.78%
1 ene 1980 año
88.945
-0.612
-0.68%
1 ene 1981 año
88.417
-0.528
-0.59%
1 ene 1982 año
88.109
-0.308
-0.35%
1 ene 1983 año
88.106
-0.002
0.0%
1 ene 1984 año
88.129
+0.022
0.03%
1 ene 1985 año
87.959
-0.169
-0.19%
1 ene 1986 año
88.025
+0.066
0.08%
1 ene 1987 año
88.182
+0.157
0.18%
1 ene 1988 año
88.396
+0.214
0.24%
1 ene 1989 año
88.184
-0.212
-0.24%
1 ene 1990 año
88.395
+0.212
0.24%
1 ene 1991 año
88.92
+0.525
0.59%
1 ene 1992 año
89.075
+0.155
0.17%
1 ene 1993 año
89.486
+0.41
0.46%
1 ene 1994 año
89.84
+0.354
0.4%
1 ene 1995 año
89.669
-0.17
-0.19%
1 ene 1996 año
89.399
-0.27
-0.3%
1 ene 1997 año
89.211
-0.189
-0.21%
1 ene 1998 año
89.006
-0.205
-0.23%
1 ene 1999 año
88.828
-0.178
-0.2%
1 ene 2000 año
88.648
-0.18
-0.2%
1 ene 2001 año
88.436
-0.212
-0.24%
1 ene 2002 año
88.002
-0.434
-0.49%
1 ene 2003 año
87.58
-0.422
-0.48%
1 ene 2004 año
87.224
-0.356
-0.41%
1 ene 2005 año
86.635
-0.589
-0.67%
1 ene 2006 año
86.3
-0.335
-0.39%
1 ene 2007 año
85.993
-0.307
-0.36%
1 ene 2008 año
85.71
-0.283
-0.33%
1 ene 2009 año
85.384
-0.326
-0.38%
Ranking de los países por los datos estadísticos actuales


Comentarios: