29
/es/
es
AIzaSyAYiBZKx7MnpbEhh9jyipgxe19OcubqV5w
April 1, 2024
220432
Paraguay
PRY
true
2
1
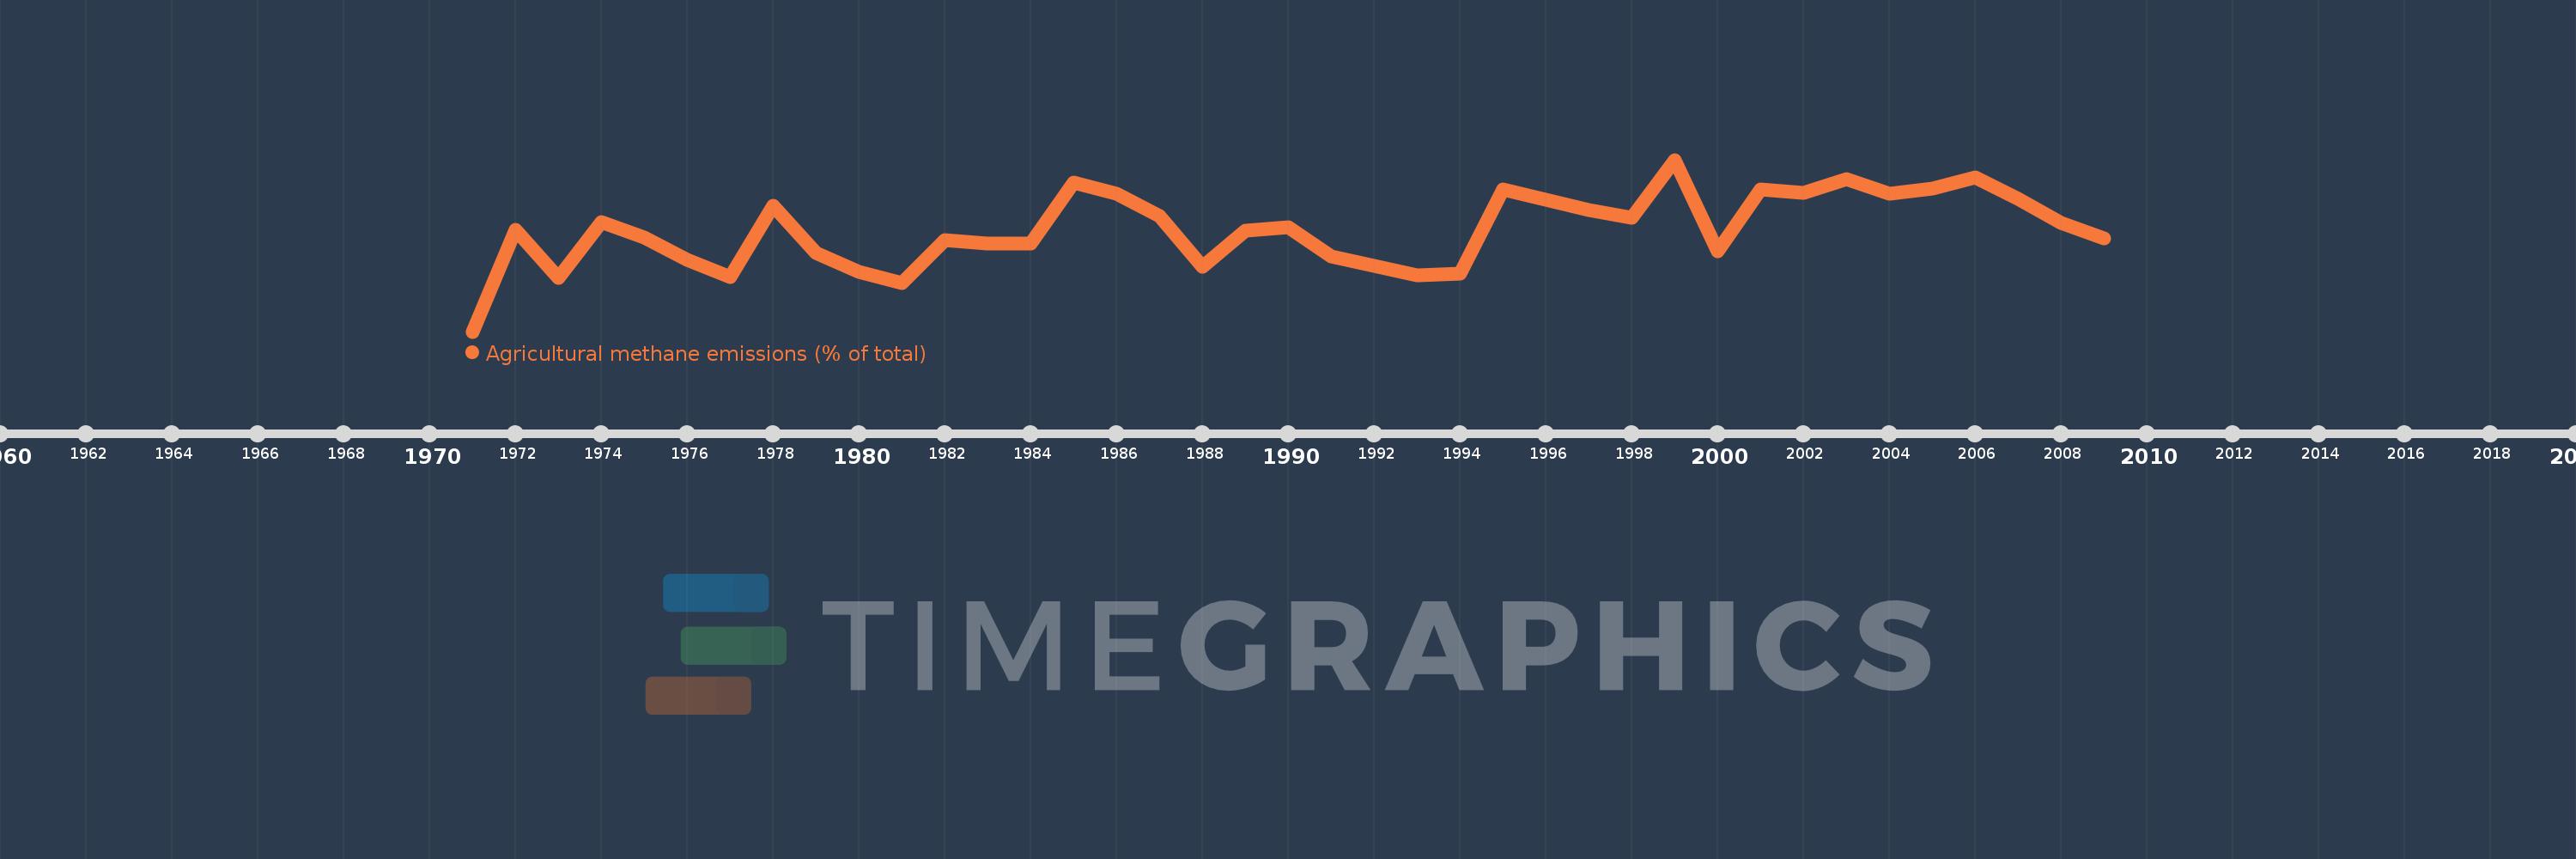
Agricultural methane emissions (% of total)
2009,2008,2007,2006,2005,2004,2003,2002,2001,2000,1999,1998,1997,1996,1995,1994,1993,1992,1991,1990,1989,1988,1987,1986,1985,1984,1983,1982,1981,1980,1979,1978,1977,1976,1975,1974,1973,1972,1971
Estas estadísticas en otros países:
AfghanistanAlbaniaAlgeriaAmerican SamoaAngolaAntigua and BarbudaArab WorldArgentinaArmeniaArubaAustraliaAustriaAzerbaijanBahamas, TheBahrainBangladeshBarbadosBelarusBelgiumBelizeBeninBermudaBhutanBoliviaBosnia and HerzegovinaBotswanaBrazilBritish Virgin IslandsBrunei DarussalamBulgariaBurkina FasoBurundiCabo VerdeCambodiaCameroonCanadaCaribbean small statesCayman IslandsCentral African RepublicCentral Europe and the BalticsChadChileChinaColombiaComorosCongo, Dem. Rep.Congo, Rep.Costa RicaCote d'IvoireCroatiaCubaCyprusCzech RepublicDenmarkDjiboutiDominicaDominican RepublicEarly-demographic dividendEast Asia & PacificEast Asia & Pacific (excluding high income)East Asia & Pacific (IDA & IBRD countries)EcuadorEgypt, Arab Rep.El SalvadorEquatorial GuineaEritreaEstoniaEthiopiaEuro areaEurope & Central AsiaEurope & Central Asia (excluding high income)Europe & Central Asia (IDA & IBRD countries)European UnionFaroe IslandsFijiFinlandFragile and conflict affected situationsFranceFrench PolynesiaGabonGambia, TheGeorgiaGermanyGhanaGibraltarGreeceGreenlandGrenadaGuamGuatemalaGuineaGuinea-BissauGuyanaHaitiHeavily indebted poor countries (HIPC)High incomeHondurasHong Kong SAR, ChinaHungaryIBRD onlyIcelandIDA & IBRD totalIDA blendIDA onlyIDA totalIndiaIndonesiaIran, Islamic Rep.IraqIrelandIsraelItalyJamaicaJapanJordanKazakhstanKenyaKiribatiKorea, Dem. People’s Rep.Korea, Rep.KuwaitKyrgyz RepublicLao PDRLate-demographic dividendLatin America & Caribbean Latin America & Caribbean (excluding high income)Latin America & the Caribbean (IDA & IBRD countries)LatviaLeast developed countries: UN classificationLebanonLesothoLiberiaLibyaLithuaniaLow & middle incomeLow incomeLower middle incomeLuxembourgMacao SAR, ChinaMacedonia, FYRMadagascarMalawiMalaysiaMaldivesMaliMaltaMarshall IslandsMauritaniaMauritiusMexicoMicronesia, Fed. Sts.Middle East & North AfricaMiddle East & North Africa (excluding high income)Middle East & North Africa (IDA & IBRD countries)Middle incomeMoldovaMongoliaMoroccoMozambiqueMyanmarNamibiaNauruNepalNetherlandsNew CaledoniaNew ZealandNicaraguaNigerNigeriaNorth AmericaNorthern Mariana IslandsNorwayOECD membersOmanOther small statesPacific island small statesPakistanPalauPanamaPapua New GuineaParaguayPeruPhilippinesPolandPortugalPost-demographic dividendPre-demographic dividendPuerto RicoQatarRomaniaRussian FederationRwandaSamoaSao Tome and PrincipeSaudi ArabiaSenegalSerbiaSeychellesSierra LeoneSingaporeSlovak RepublicSloveniaSmall statesSolomon IslandsSomaliaSouth AfricaSouth AsiaSouth Asia (IDA & IBRD)SpainSri LankaSt. Kitts and NevisSt. LuciaSt. Vincent and the GrenadinesSub-Saharan Africa Sub-Saharan Africa (excluding high income)Sub-Saharan Africa (IDA & IBRD countries)SudanSurinameSwazilandSwedenSwitzerlandSyrian Arab RepublicTajikistanTanzaniaThailandTimor-LesteTogoTongaTrinidad and TobagoTunisiaTurkeyTurkmenistanTurks and Caicos IslandsTuvaluUgandaUkraineUnited Arab EmiratesUnited KingdomUnited StatesUpper middle incomeUruguayUzbekistanVanuatuVenezuela, RBVietnamVirgin Islands (U.S.)WorldYemen, Rep.ZambiaZimbabwe línea de tiempo (timeline):
En esta escala de tiempo se presenta un gráfico de 1971 y 2009 de Paraguay. Los datos de 1970 están ausentes. El número de observaciones reales por fecha: 39.
Fuente (nombre):
Indicadores del desarrollo mundial
Fuente (organización):
World Bank staff estimates from original source: European Commission, Joint Research Centre (JRC)/Netherlands Environmental Assessment Agency (PBL). Emission Database for Global Atmospheric Research (EDGAR): http://edgar.jrc.ec.europa.eu/.
Categorías:
Agriculture & Rural Development, Environment
Se ha actualizado:
23 abr 2017 año
Los indicadores de los cambios de valor en los últimos años
Mínimo:
72.013
1 ene 1971 año
Máximo:
83.824
1 ene 1999 año
A la fecha de observación
Valor
Cambio absoluto
El cambio con respecto al valor anterior
1 ene 1971 año
72.013
+72.013
0.0%
1 ene 1972 año
79.023
+7.01
9.73%
1 ene 1973 año
75.697
-3.326
-4.21%
1 ene 1974 año
79.561
+3.864
5.11%
1 ene 1975 año
78.478
-1.083
-1.36%
1 ene 1976 año
76.956
-1.522
-1.94%
1 ene 1977 año
75.739
-1.217
-1.58%
1 ene 1978 año
80.665
+4.926
6.5%
1 ene 1979 año
77.391
-3.274
-4.06%
1 ene 1980 año
76.095
-1.296
-1.67%
1 ene 1981 año
75.36
-0.735
-0.97%
1 ene 1982 año
78.312
+2.952
3.92%
1 ene 1983 año
78.055
-0.257
-0.33%
1 ene 1984 año
78.089
+0.034
0.04%
1 ene 1985 año
82.271
+4.182
5.36%
1 ene 1986 año
81.506
-0.765
-0.93%
1 ene 1987 año
79.942
-1.564
-1.92%
1 ene 1988 año
76.483
-3.459
-4.33%
1 ene 1989 año
78.958
+2.475
3.24%
1 ene 1990 año
79.162
+0.204
0.26%
1 ene 1991 año
77.169
-1.992
-2.52%
1 ene 1992 año
76.541
-0.628
-0.81%
1 ene 1993 año
75.897
-0.644
-0.84%
1 ene 1994 año
75.971
+0.074
0.1%
1 ene 1995 año
81.758
+5.787
7.62%
1 ene 1996 año
81.084
-0.674
-0.82%
1 ene 1997 año
80.352
-0.733
-0.9%
1 ene 1998 año
79.837
-0.515
-0.64%
1 ene 1999 año
83.824
+3.987
4.99%
1 ene 2000 año
77.517
-6.307
-7.52%
1 ene 2001 año
81.8
+4.284
5.53%
1 ene 2002 año
81.549
-0.251
-0.31%
1 ene 2003 año
82.482
+0.932
1.14%
1 ene 2004 año
81.5
-0.982
-1.19%
1 ene 2005 año
81.856
+0.356
0.44%
1 ene 2006 año
82.588
+0.732
0.89%
1 ene 2007 año
81.147
-1.441
-1.74%
1 ene 2008 año
79.487
-1.661
-2.05%
1 ene 2009 año
78.43
-1.056
-1.33%
Ranking de los países por los datos estadísticos actuales


Comentarios: