29
/es/
es
AIzaSyAYiBZKx7MnpbEhh9jyipgxe19OcubqV5w
April 1, 2024
77726
Bahrain
BHR
true
2
1
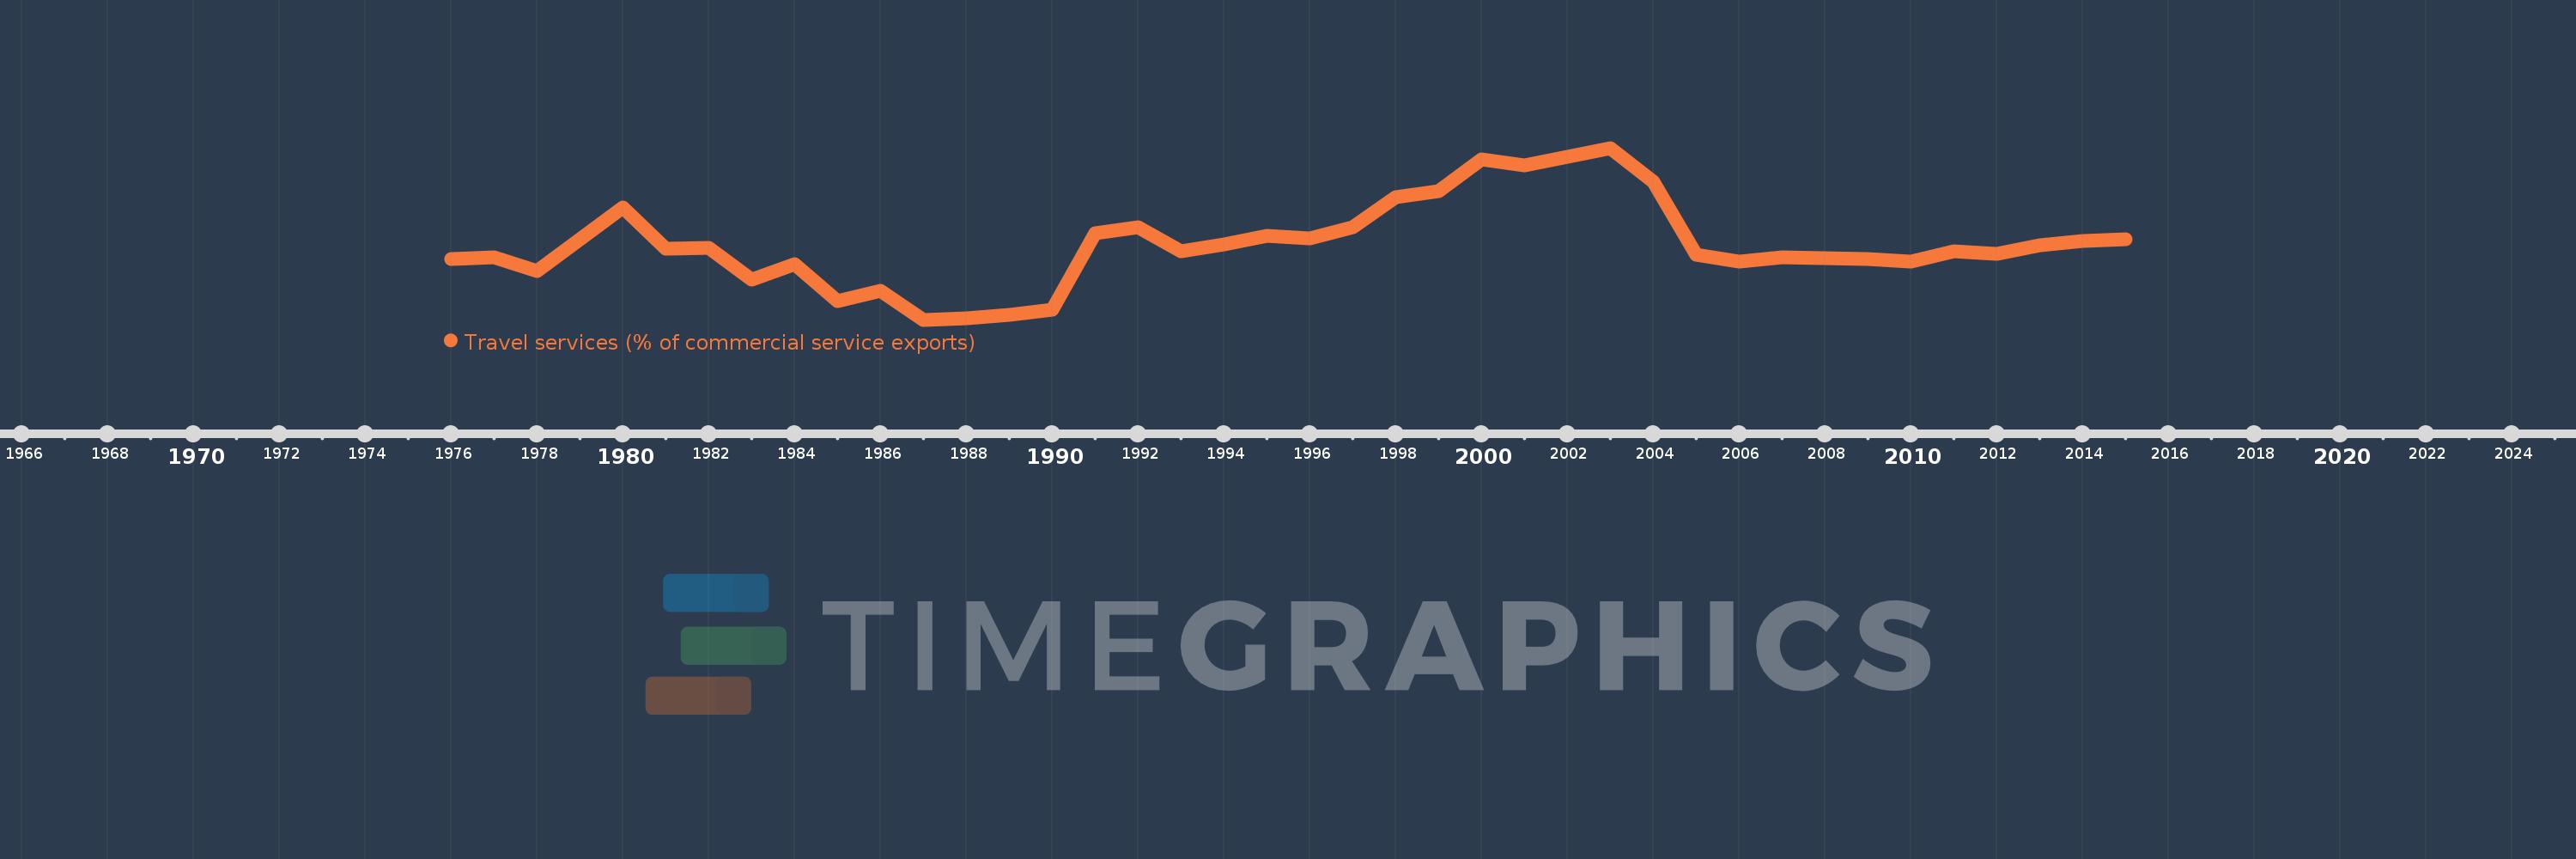
Travel services (% of commercial service exports)
2015,2014,2013,2012,2011,2010,2009,2008,2007,2006,2005,2004,2003,2002,2001,2000,1999,1998,1997,1996,1995,1994,1993,1992,1991,1990,1989,1988,1987,1986,1985,1984,1983,1982,1981,1980,1979,1978,1977,1976
Estas estadísticas en otros países:
AfghanistanAlbaniaAlgeriaAngolaAntigua and BarbudaArab WorldArgentinaArmeniaArubaAustraliaAustriaAzerbaijanBahamas, TheBahrainBangladeshBarbadosBelarusBelgiumBelizeBeninBermudaBhutanBoliviaBosnia and HerzegovinaBotswanaBrazilBrunei DarussalamBulgariaBurkina FasoBurundiCabo VerdeCambodiaCameroonCanadaCaribbean small statesCentral African RepublicCentral Europe and the BalticsChadChileChinaColombiaComorosCongo, Dem. Rep.Congo, Rep.Costa RicaCote d'IvoireCroatiaCuracaoCyprusCzech RepublicDenmarkDjiboutiDominicaDominican RepublicEarly-demographic dividendEast Asia & PacificEast Asia & Pacific (excluding high income)East Asia & Pacific (IDA & IBRD countries)EcuadorEgypt, Arab Rep.El SalvadorEritreaEstoniaEthiopiaEuro areaEurope & Central AsiaEurope & Central Asia (excluding high income)Europe & Central Asia (IDA & IBRD countries)European UnionFaroe IslandsFijiFinlandFragile and conflict affected situationsFranceFrench PolynesiaGabonGambia, TheGeorgiaGermanyGhanaGreeceGrenadaGuatemalaGuineaGuinea-BissauGuyanaHaitiHeavily indebted poor countries (HIPC)High incomeHondurasHong Kong SAR, ChinaHungaryIBRD onlyIcelandIDA & IBRD totalIDA onlyIDA totalIndiaIndonesiaIran, Islamic Rep.IraqIrelandIsraelItalyJamaicaJapanJordanKazakhstanKenyaKiribatiKorea, Rep.KosovoKuwaitKyrgyz RepublicLao PDRLate-demographic dividendLatin America & Caribbean Latin America & Caribbean (excluding high income)Latin America & the Caribbean (IDA & IBRD countries)LatviaLeast developed countries: UN classificationLebanonLesothoLiberiaLibyaLithuaniaLow & middle incomeLow incomeLower middle incomeLuxembourgMacao SAR, ChinaMacedonia, FYRMadagascarMalawiMalaysiaMaldivesMaliMaltaMarshall IslandsMauritaniaMauritiusMexicoMicronesia, Fed. Sts.Middle East & North Africa (excluding high income)Middle East & North Africa (IDA & IBRD countries)Middle incomeMoldovaMongoliaMontenegroMoroccoMozambiqueMyanmarNamibiaNepalNetherlandsNew CaledoniaNew ZealandNicaraguaNigerNigeriaNorth AmericaNorwayOECD membersOmanOther small statesPacific island small statesPakistanPalauPanamaPapua New GuineaParaguayPeruPhilippinesPolandPortugalPost-demographic dividendPre-demographic dividendQatarRomaniaRussian FederationRwandaSamoaSao Tome and PrincipeSaudi ArabiaSenegalSerbiaSeychellesSierra LeoneSingaporeSint Maarten (Dutch part)Slovak RepublicSloveniaSmall statesSolomon IslandsSouth AfricaSouth AsiaSouth Asia (IDA & IBRD)South SudanSpainSri LankaSt. Kitts and NevisSt. LuciaSt. Vincent and the GrenadinesSub-Saharan Africa Sub-Saharan Africa (excluding high income)Sub-Saharan Africa (IDA & IBRD countries)SudanSurinameSwazilandSwedenSwitzerlandSyrian Arab RepublicTajikistanTanzaniaThailandTimor-LesteTogoTongaTrinidad and TobagoTunisiaTurkeyTuvaluUgandaUkraineUnited KingdomUnited StatesUpper middle incomeUruguayVanuatuVenezuela, RBWest Bank and GazaWorldYemen, Rep.ZambiaZimbabwe línea de tiempo (timeline):
En esta escala de tiempo se presenta un gráfico de 1976 y 2015 de Bahrain. Los datos de 1975 están ausentes. El número de observaciones reales por fecha: 40.
Fuente (nombre):
Indicadores del desarrollo mundial
Fuente (organización):
International Monetary Fund, Balance of Payments Statistics Yearbook and data files.
Categorías:
Private Sector, Trade
Se ha actualizado:
23 abr 2017 año
Los indicadores de los cambios de valor en los últimos años
Mínimo:
11.309
1 ene 1987 año
Máximo:
63.787
1 ene 2003 año
A la fecha de observación
Valor
Cambio absoluto
El cambio con respecto al valor anterior
1 ene 1976 año
29.77
+29.77
0.0%
1 ene 1977 año
30.446
+0.676
2.27%
1 ene 1978 año
26.179
-4.267
-14.02%
1 ene 1979 año
36.011
+9.833
37.56%
1 ene 1980 año
45.626
+9.615
26.7%
1 ene 1981 año
33.088
-12.538
-27.48%
1 ene 1982 año
33.308
+0.22
0.66%
1 ene 1983 año
23.63
-9.678
-29.06%
1 ene 1984 año
28.274
+4.644
19.65%
1 ene 1985 año
16.961
-11.313
-40.01%
1 ene 1986 año
20.024
+3.063
18.06%
1 ene 1987 año
11.309
-8.715
-43.52%
1 ene 1988 año
11.785
+0.476
4.21%
1 ene 1989 año
12.704
+0.919
7.8%
1 ene 1990 año
14.361
+1.657
13.04%
1 ene 1991 año
37.834
+23.473
163.45%
1 ene 1992 año
39.457
+1.623
4.29%
1 ene 1993 año
32.337
-7.12
-18.04%
1 ene 1994 año
34.272
+1.935
5.98%
1 ene 1995 año
37.037
+2.765
8.07%
1 ene 1996 año
36.201
-0.836
-2.26%
1 ene 1997 año
39.521
+3.32
9.17%
1 ene 1998 año
48.831
+9.31
23.56%
1 ene 1999 año
50.532
+1.701
3.48%
1 ene 2000 año
60.36
+9.828
19.45%
1 ene 2001 año
58.389
-1.971
-3.27%
1 ene 2002 año
61.144
+2.755
4.72%
1 ene 2003 año
63.787
+2.643
4.32%
1 ene 2004 año
53.364
-10.424
-16.34%
1 ene 2005 año
31.104
-22.26
-41.71%
1 ene 2006 año
29.155
-1.949
-6.27%
1 ene 2007 año
30.26
+1.106
3.79%
1 ene 2008 año
30.022
-0.239
-0.79%
1 ene 2009 año
29.777
-0.245
-0.82%
1 ene 2010 año
29.184
-0.592
-1.99%
1 ene 2011 año
32.167
+2.983
10.22%
1 ene 2012 año
31.391
-0.776
-2.41%
1 ene 2013 año
34.052
+2.661
8.48%
1 ene 2014 año
35.299
+1.247
3.66%
1 ene 2015 año
35.885
+0.586
1.66%
Ranking de los países por los datos estadísticos actuales


Comentarios: