29
/es/
es
AIzaSyAYiBZKx7MnpbEhh9jyipgxe19OcubqV5w
April 1, 2024
255932
Swaziland
SWZ
true
2
1
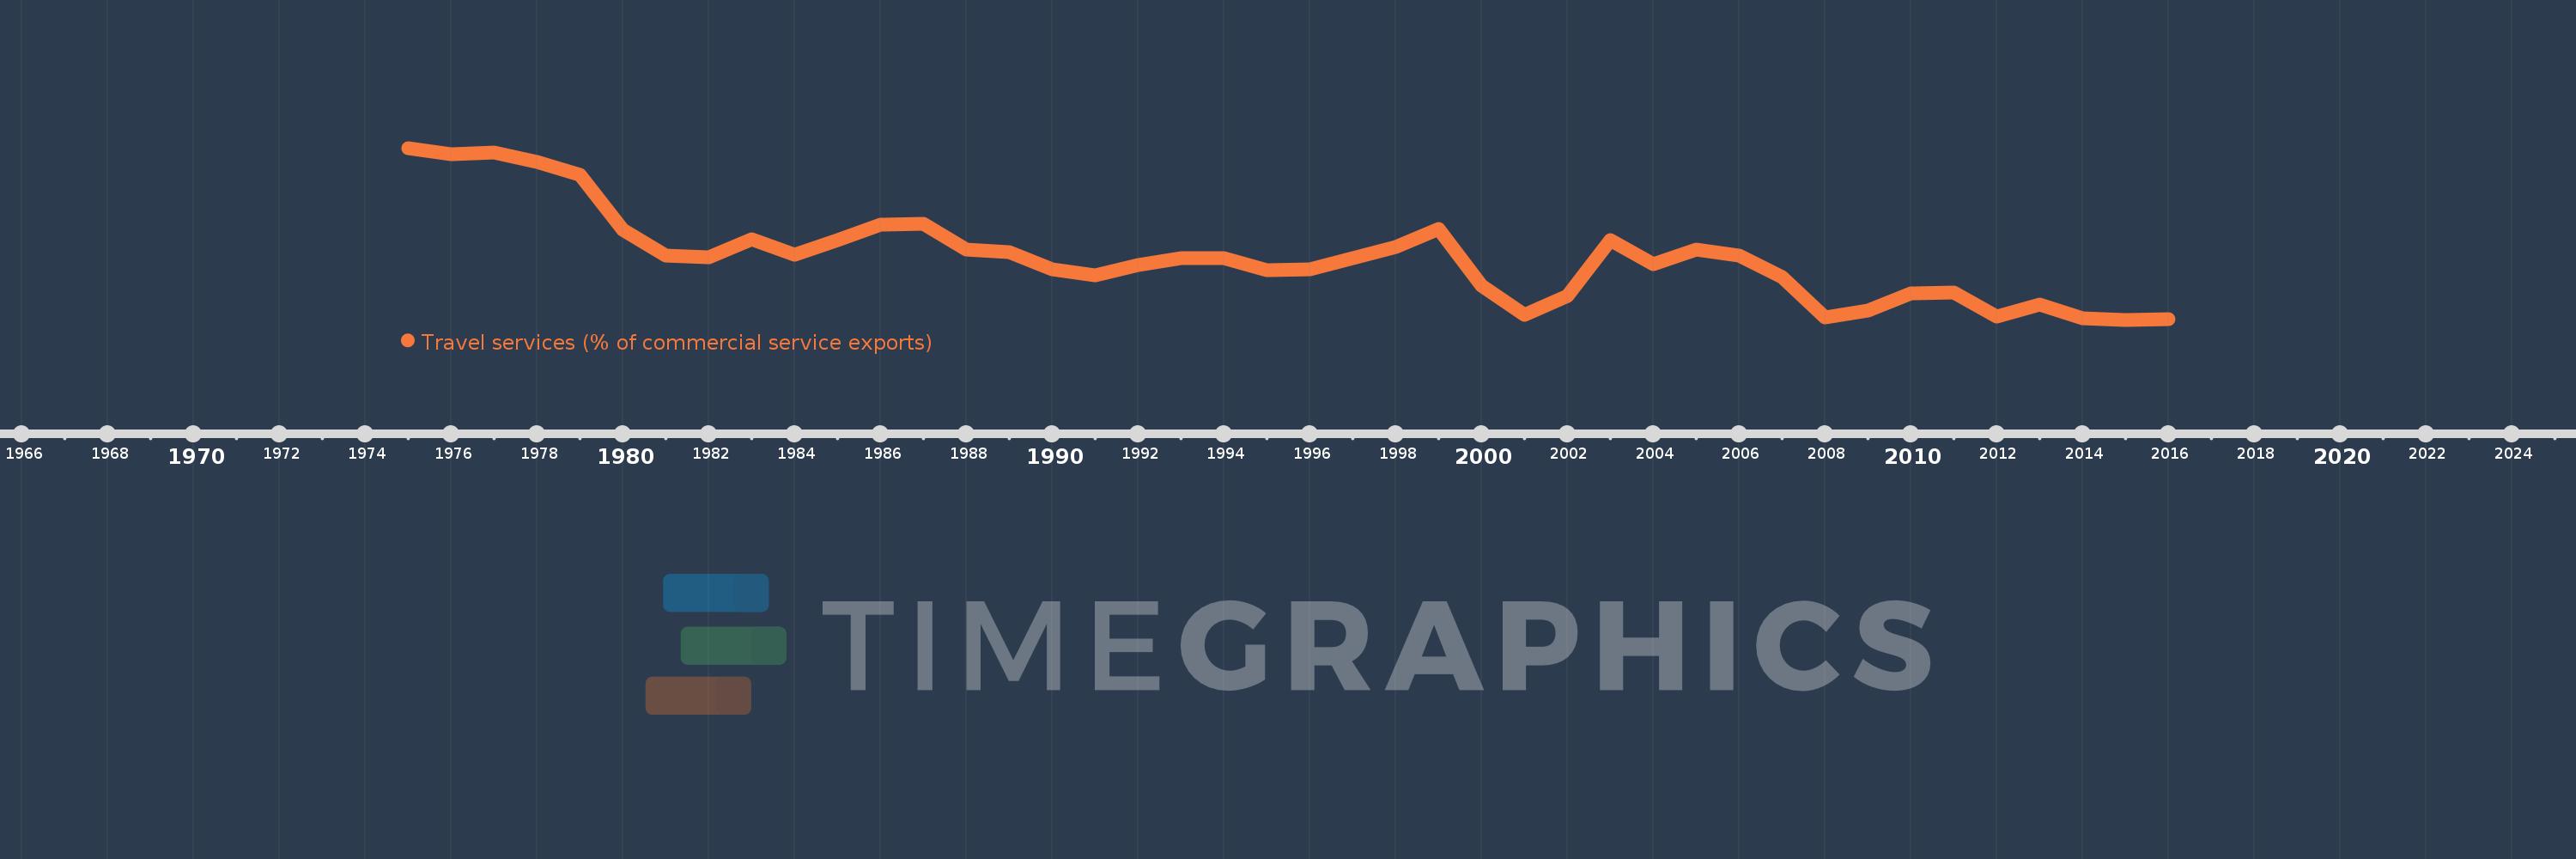
Travel services (% of commercial service exports)
2016,2015,2014,2013,2012,2011,2010,2009,2008,2007,2006,2005,2004,2003,2002,2001,2000,1999,1998,1997,1996,1995,1994,1993,1992,1991,1990,1989,1988,1987,1986,1985,1984,1983,1982,1981,1980,1979,1978,1977,1976,1975
Estas estadísticas en otros países:
AfghanistanAlbaniaAlgeriaAngolaAntigua and BarbudaArab WorldArgentinaArmeniaArubaAustraliaAustriaAzerbaijanBahamas, TheBahrainBangladeshBarbadosBelarusBelgiumBelizeBeninBermudaBhutanBoliviaBosnia and HerzegovinaBotswanaBrazilBrunei DarussalamBulgariaBurkina FasoBurundiCabo VerdeCambodiaCameroonCanadaCaribbean small statesCentral African RepublicCentral Europe and the BalticsChadChileChinaColombiaComorosCongo, Dem. Rep.Congo, Rep.Costa RicaCote d'IvoireCroatiaCuracaoCyprusCzech RepublicDenmarkDjiboutiDominicaDominican RepublicEarly-demographic dividendEast Asia & PacificEast Asia & Pacific (excluding high income)East Asia & Pacific (IDA & IBRD countries)EcuadorEgypt, Arab Rep.El SalvadorEritreaEstoniaEthiopiaEuro areaEurope & Central AsiaEurope & Central Asia (excluding high income)Europe & Central Asia (IDA & IBRD countries)European UnionFaroe IslandsFijiFinlandFragile and conflict affected situationsFranceFrench PolynesiaGabonGambia, TheGeorgiaGermanyGhanaGreeceGrenadaGuatemalaGuineaGuinea-BissauGuyanaHaitiHeavily indebted poor countries (HIPC)High incomeHondurasHong Kong SAR, ChinaHungaryIBRD onlyIcelandIDA & IBRD totalIDA onlyIDA totalIndiaIndonesiaIran, Islamic Rep.IraqIrelandIsraelItalyJamaicaJapanJordanKazakhstanKenyaKiribatiKorea, Rep.KosovoKuwaitKyrgyz RepublicLao PDRLate-demographic dividendLatin America & Caribbean Latin America & Caribbean (excluding high income)Latin America & the Caribbean (IDA & IBRD countries)LatviaLeast developed countries: UN classificationLebanonLesothoLiberiaLibyaLithuaniaLow & middle incomeLow incomeLower middle incomeLuxembourgMacao SAR, ChinaMacedonia, FYRMadagascarMalawiMalaysiaMaldivesMaliMaltaMarshall IslandsMauritaniaMauritiusMexicoMicronesia, Fed. Sts.Middle East & North Africa (excluding high income)Middle East & North Africa (IDA & IBRD countries)Middle incomeMoldovaMongoliaMontenegroMoroccoMozambiqueMyanmarNamibiaNepalNetherlandsNew CaledoniaNew ZealandNicaraguaNigerNigeriaNorth AmericaNorwayOECD membersOmanOther small statesPacific island small statesPakistanPalauPanamaPapua New GuineaParaguayPeruPhilippinesPolandPortugalPost-demographic dividendPre-demographic dividendQatarRomaniaRussian FederationRwandaSamoaSao Tome and PrincipeSaudi ArabiaSenegalSerbiaSeychellesSierra LeoneSingaporeSint Maarten (Dutch part)Slovak RepublicSloveniaSmall statesSolomon IslandsSouth AfricaSouth AsiaSouth Asia (IDA & IBRD)South SudanSpainSri LankaSt. Kitts and NevisSt. LuciaSt. Vincent and the GrenadinesSub-Saharan Africa Sub-Saharan Africa (excluding high income)Sub-Saharan Africa (IDA & IBRD countries)SudanSurinameSwazilandSwedenSwitzerlandSyrian Arab RepublicTajikistanTanzaniaThailandTimor-LesteTogoTongaTrinidad and TobagoTunisiaTurkeyTuvaluUgandaUkraineUnited KingdomUnited StatesUpper middle incomeUruguayVanuatuVenezuela, RBWest Bank and GazaWorldYemen, Rep.ZambiaZimbabwe línea de tiempo (timeline):
En esta escala de tiempo se presenta un gráfico de 1975 y 2016 de Swaziland. Los datos de 1974 están ausentes. El número de observaciones reales por fecha: 42.
Fuente (nombre):
Indicadores del desarrollo mundial
Fuente (organización):
International Monetary Fund, Balance of Payments Statistics Yearbook and data files.
Categorías:
Private Sector, Trade
Se ha actualizado:
23 abr 2017 año
Los indicadores de los cambios de valor en los últimos años
Mínimo:
5.497
1 ene 2015 año
Máximo:
97.101
1 ene 1975 año
A la fecha de observación
Valor
Cambio absoluto
El cambio con respecto al valor anterior
1 ene 1975 año
97.101
+97.101
0.0%
1 ene 1976 año
93.671
-3.431
-3.53%
1 ene 1977 año
94.792
+1.121
1.2%
1 ene 1978 año
89.72
-5.072
-5.35%
1 ene 1979 año
82.569
-7.151
-7.97%
1 ene 1980 año
53.476
-29.093
-35.23%
1 ene 1981 año
39.759
-13.717
-25.65%
1 ene 1982 año
38.739
-1.02
-2.57%
1 ene 1983 año
48.418
+9.679
24.99%
1 ene 1984 año
40.097
-8.321
-17.19%
1 ene 1985 año
47.856
+7.759
19.35%
1 ene 1986 año
56.19
+8.335
17.42%
1 ene 1987 año
56.806
+0.616
1.1%
1 ene 1988 año
42.944
-13.862
-24.4%
1 ene 1989 año
41.492
-1.452
-3.38%
1 ene 1990 año
32.272
-9.22
-22.22%
1 ene 1991 año
29.222
-3.05
-9.45%
1 ene 1992 año
34.576
+5.354
18.32%
1 ene 1993 año
38.396
+3.82
11.05%
1 ene 1994 año
38.187
-0.209
-0.54%
1 ene 1995 año
32.038
-6.149
-16.1%
1 ene 1996 año
32.252
+0.214
0.67%
1 ene 1997 año
38.302
+6.05
18.76%
1 ene 1998 año
44.276
+5.974
15.6%
1 ene 1999 año
53.886
+9.61
21.71%
1 ene 2000 año
23.685
-30.201
-56.05%
1 ene 2001 año
7.93
-15.755
-66.52%
1 ene 2002 año
18.38
+10.45
131.79%
1 ene 2003 año
48.116
+29.736
161.78%
1 ene 2004 año
34.905
-13.211
-27.46%
1 ene 2005 año
42.804
+7.899
22.63%
1 ene 2006 año
39.796
-3.008
-7.03%
1 ene 2007 año
28.108
-11.688
-29.37%
1 ene 2008 año
6.517
-21.591
-76.81%
1 ene 2009 año
10.399
+3.882
59.56%
1 ene 2010 año
19.741
+9.342
89.84%
1 ene 2011 año
20.181
+0.44
2.23%
1 ene 2012 año
7.139
-13.042
-64.63%
1 ene 2013 año
13.46
+6.321
88.55%
1 ene 2014 año
6.262
-7.198
-53.48%
1 ene 2015 año
5.497
-0.765
-12.21%
1 ene 2016 año
5.884
+0.387
7.03%
Ranking de los países por los datos estadísticos actuales


Comentarios: