29
/es/
es
AIzaSyAYiBZKx7MnpbEhh9jyipgxe19OcubqV5w
April 1, 2024
117517
Cyprus
CYP
true
2
1
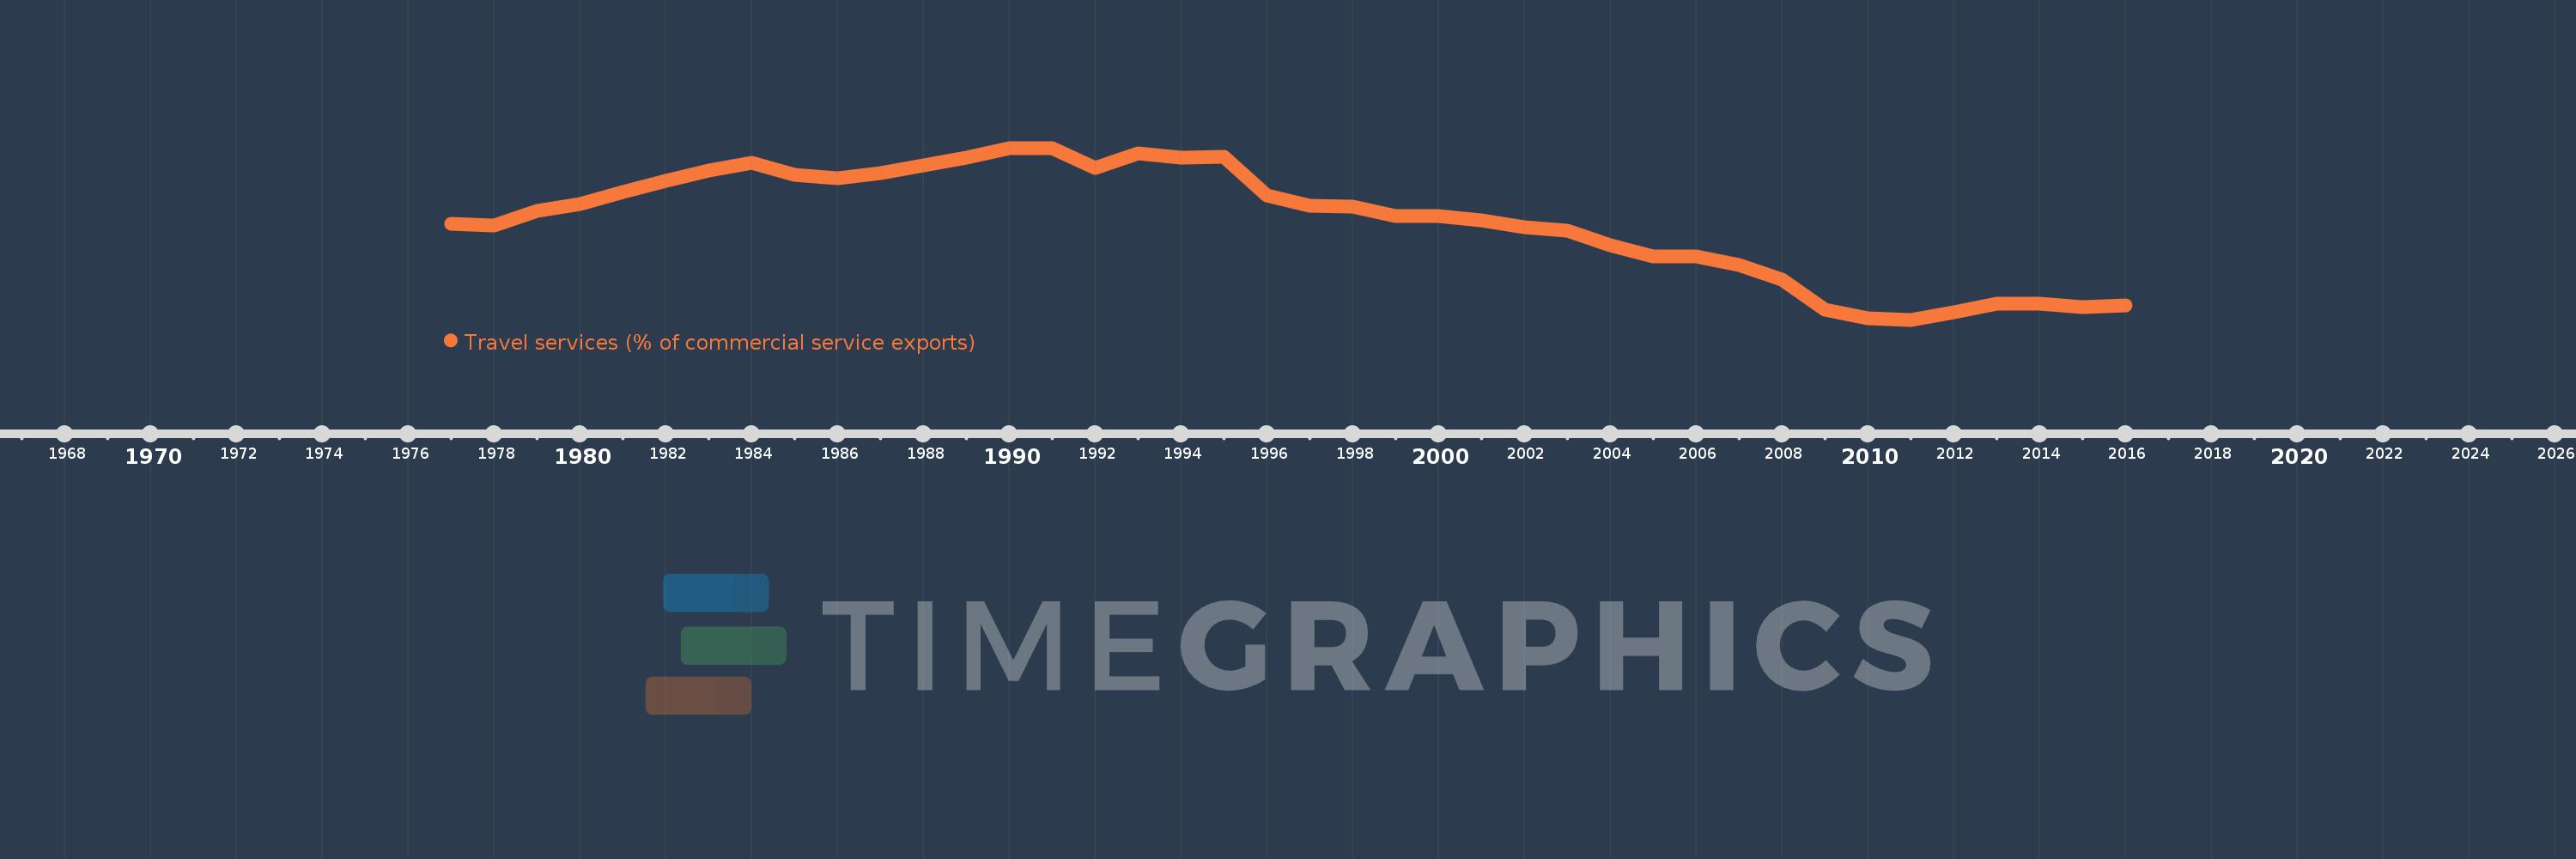
Travel services (% of commercial service exports)
2016,2015,2014,2013,2012,2011,2010,2009,2008,2007,2006,2005,2004,2003,2002,2001,2000,1999,1998,1997,1996,1995,1994,1993,1992,1991,1990,1989,1988,1987,1986,1985,1984,1983,1982,1981,1980,1979,1978,1977
Estas estadísticas en otros países:
AfghanistanAlbaniaAlgeriaAngolaAntigua and BarbudaArab WorldArgentinaArmeniaArubaAustraliaAustriaAzerbaijanBahamas, TheBahrainBangladeshBarbadosBelarusBelgiumBelizeBeninBermudaBhutanBoliviaBosnia and HerzegovinaBotswanaBrazilBrunei DarussalamBulgariaBurkina FasoBurundiCabo VerdeCambodiaCameroonCanadaCaribbean small statesCentral African RepublicCentral Europe and the BalticsChadChileChinaColombiaComorosCongo, Dem. Rep.Congo, Rep.Costa RicaCote d'IvoireCroatiaCuracaoCyprusCzech RepublicDenmarkDjiboutiDominicaDominican RepublicEarly-demographic dividendEast Asia & PacificEast Asia & Pacific (excluding high income)East Asia & Pacific (IDA & IBRD countries)EcuadorEgypt, Arab Rep.El SalvadorEritreaEstoniaEthiopiaEuro areaEurope & Central AsiaEurope & Central Asia (excluding high income)Europe & Central Asia (IDA & IBRD countries)European UnionFaroe IslandsFijiFinlandFragile and conflict affected situationsFranceFrench PolynesiaGabonGambia, TheGeorgiaGermanyGhanaGreeceGrenadaGuatemalaGuineaGuinea-BissauGuyanaHaitiHeavily indebted poor countries (HIPC)High incomeHondurasHong Kong SAR, ChinaHungaryIBRD onlyIcelandIDA & IBRD totalIDA onlyIDA totalIndiaIndonesiaIran, Islamic Rep.IraqIrelandIsraelItalyJamaicaJapanJordanKazakhstanKenyaKiribatiKorea, Rep.KosovoKuwaitKyrgyz RepublicLao PDRLate-demographic dividendLatin America & Caribbean Latin America & Caribbean (excluding high income)Latin America & the Caribbean (IDA & IBRD countries)LatviaLeast developed countries: UN classificationLebanonLesothoLiberiaLibyaLithuaniaLow & middle incomeLow incomeLower middle incomeLuxembourgMacao SAR, ChinaMacedonia, FYRMadagascarMalawiMalaysiaMaldivesMaliMaltaMarshall IslandsMauritaniaMauritiusMexicoMicronesia, Fed. Sts.Middle East & North Africa (excluding high income)Middle East & North Africa (IDA & IBRD countries)Middle incomeMoldovaMongoliaMontenegroMoroccoMozambiqueMyanmarNamibiaNepalNetherlandsNew CaledoniaNew ZealandNicaraguaNigerNigeriaNorth AmericaNorwayOECD membersOmanOther small statesPacific island small statesPakistanPalauPanamaPapua New GuineaParaguayPeruPhilippinesPolandPortugalPost-demographic dividendPre-demographic dividendQatarRomaniaRussian FederationRwandaSamoaSao Tome and PrincipeSaudi ArabiaSenegalSerbiaSeychellesSierra LeoneSingaporeSint Maarten (Dutch part)Slovak RepublicSloveniaSmall statesSolomon IslandsSouth AfricaSouth AsiaSouth Asia (IDA & IBRD)South SudanSpainSri LankaSt. Kitts and NevisSt. LuciaSt. Vincent and the GrenadinesSub-Saharan Africa Sub-Saharan Africa (excluding high income)Sub-Saharan Africa (IDA & IBRD countries)SudanSurinameSwazilandSwedenSwitzerlandSyrian Arab RepublicTajikistanTanzaniaThailandTimor-LesteTogoTongaTrinidad and TobagoTunisiaTurkeyTuvaluUgandaUkraineUnited KingdomUnited StatesUpper middle incomeUruguayVanuatuVenezuela, RBWest Bank and GazaWorldYemen, Rep.ZambiaZimbabwe línea de tiempo (timeline):
En esta escala de tiempo se presenta un gráfico de 1977 y 2016 de Cyprus. Los datos de 1976 están ausentes. El número de observaciones reales por fecha: 40.
Fuente (nombre):
Indicadores del desarrollo mundial
Fuente (organización):
International Monetary Fund, Balance of Payments Statistics Yearbook and data files.
Categorías:
Private Sector, Trade
Se ha actualizado:
23 abr 2017 año
Los indicadores de los cambios de valor en los últimos años
Mínimo:
23.195
1 ene 2011 año
Máximo:
71.251
1 ene 1991 año
A la fecha de observación
Valor
Cambio absoluto
El cambio con respecto al valor anterior
1 ene 1977 año
50.0
+50.0
0.0%
1 ene 1978 año
49.48
-0.52
-1.04%
1 ene 1979 año
53.623
+4.143
8.37%
1 ene 1980 año
55.605
+1.982
3.7%
1 ene 1981 año
58.819
+3.214
5.78%
1 ene 1982 año
62.098
+3.28
5.58%
1 ene 1983 año
64.934
+2.836
4.57%
1 ene 1984 año
67.102
+2.167
3.34%
1 ene 1985 año
63.836
-3.266
-4.87%
1 ene 1986 año
62.754
-1.083
-1.7%
1 ene 1987 año
64.131
+1.377
2.19%
1 ene 1988 año
66.412
+2.281
3.56%
1 ene 1989 año
68.592
+2.18
3.28%
1 ene 1990 año
71.088
+2.496
3.64%
1 ene 1991 año
71.251
+0.164
0.23%
1 ene 1992 año
65.659
-5.592
-7.85%
1 ene 1993 año
69.844
+4.185
6.37%
1 ene 1994 año
68.649
-1.195
-1.71%
1 ene 1995 año
68.844
+0.195
0.28%
1 ene 1996 año
57.982
-10.863
-15.78%
1 ene 1997 año
55.184
-2.798
-4.83%
1 ene 1998 año
54.92
-0.264
-0.48%
1 ene 1999 año
52.11
-2.81
-5.12%
1 ene 2000 año
52.288
+0.178
0.34%
1 ene 2001 año
51.1
-1.188
-2.27%
1 ene 2002 año
49.015
-2.085
-4.08%
1 ene 2003 año
48.016
-0.999
-2.04%
1 ene 2004 año
44.141
-3.875
-8.07%
1 ene 2005 año
40.913
-3.228
-7.31%
1 ene 2006 año
40.832
-0.081
-0.2%
1 ene 2007 año
38.489
-2.343
-5.74%
1 ene 2008 año
34.431
-4.058
-10.54%
1 ene 2009 año
26.085
-8.346
-24.24%
1 ene 2010 año
23.635
-2.451
-9.39%
1 ene 2011 año
23.195
-0.44
-1.86%
1 ene 2012 año
25.327
+2.132
9.19%
1 ene 2013 año
27.585
+2.258
8.92%
1 ene 2014 año
27.746
+0.161
0.58%
1 ene 2015 año
26.702
-1.044
-3.76%
1 ene 2016 año
27.12
+0.418
1.57%
Ranking de los países por los datos estadísticos actuales


Comentarios: