29
/es/
es
AIzaSyAYiBZKx7MnpbEhh9jyipgxe19OcubqV5w
April 1, 2024
77167
Bahrain
BHR
true
2
1
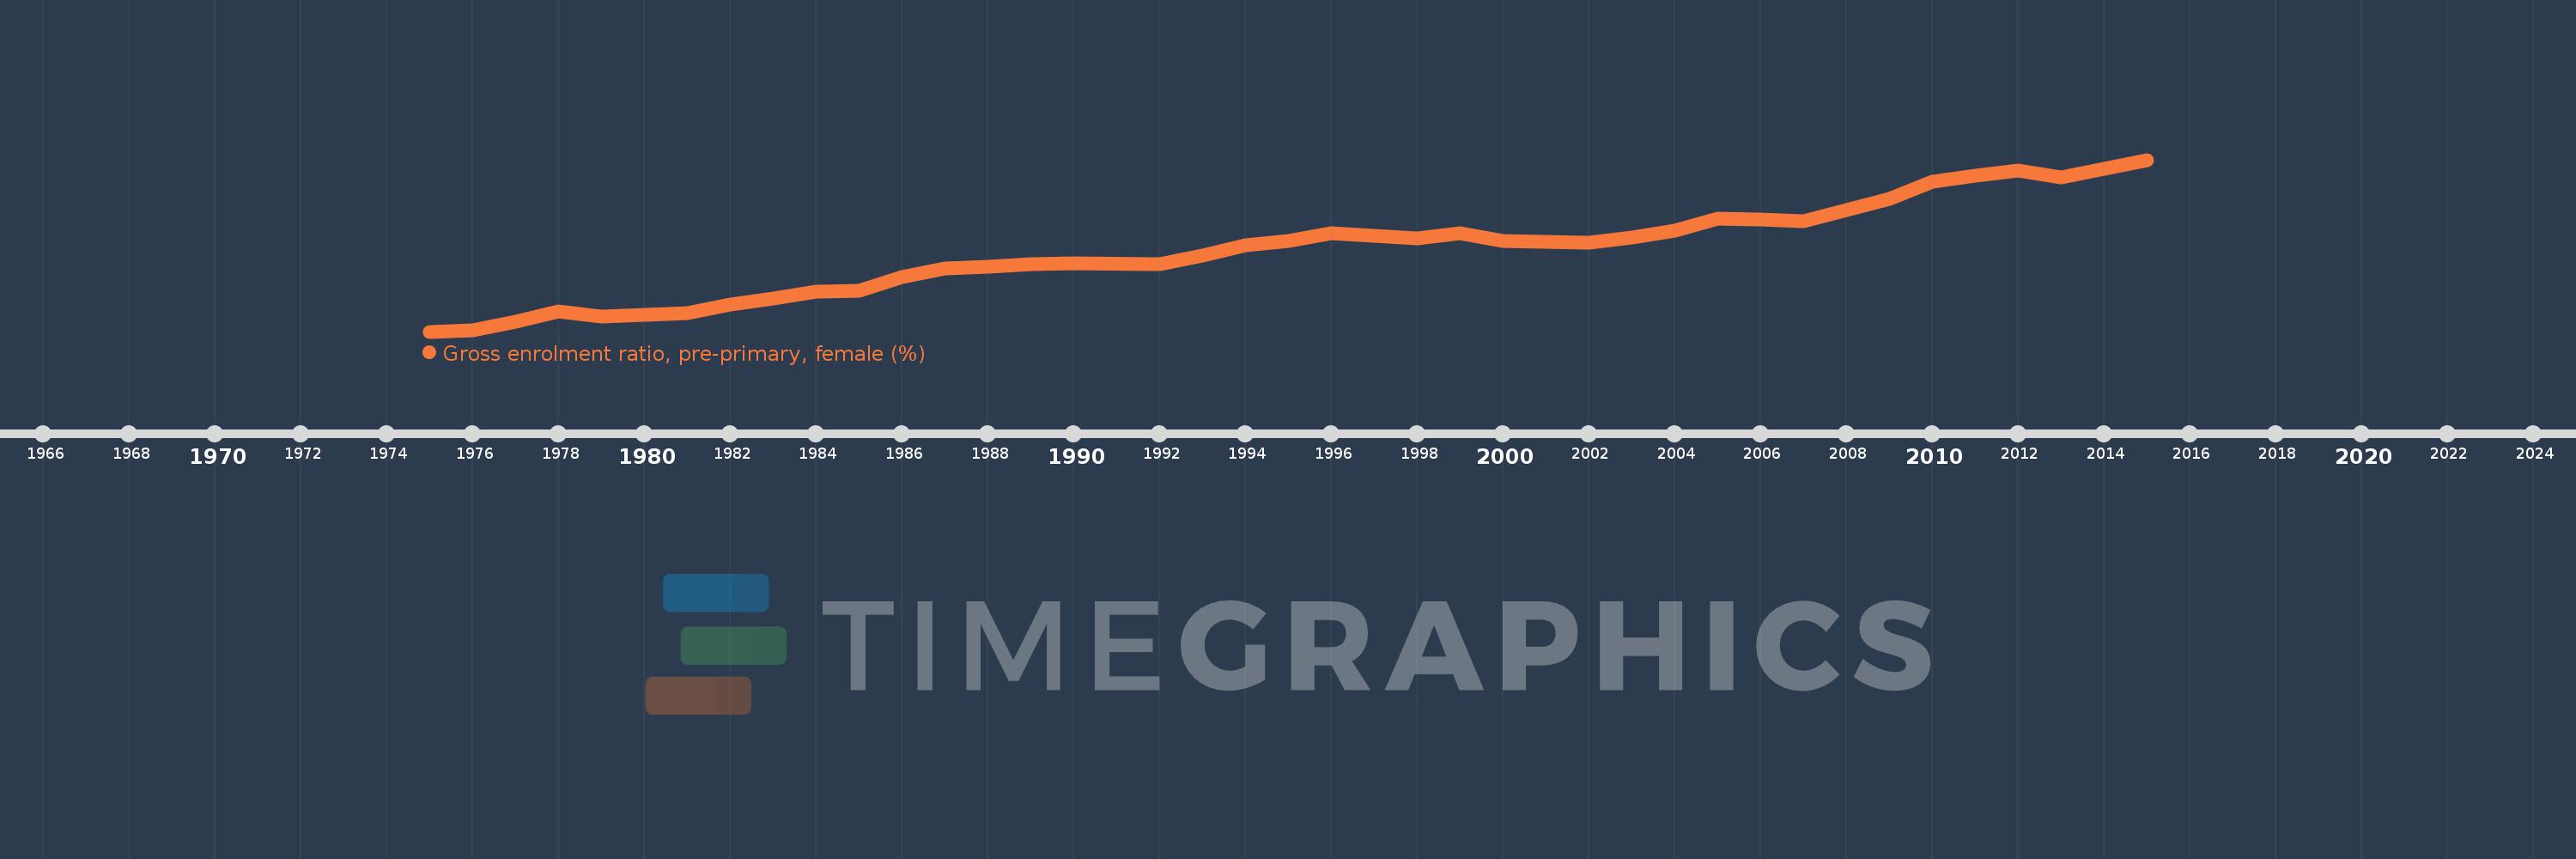
Gross enrolment ratio, pre-primary, female (%)
2015,2014,2013,2012,2011,2010,2009,2007,2006,2005,2004,2003,2002,2001,2000,1999,1998,1997,1996,1995,1994,1993,1992,1990,1989,1988,1987,1986,1985,1984,1983,1982,1981,1980,1979,1978,1977,1976,1975
Estas estadísticas en otros países:
AfghanistanAlbaniaAlgeriaAndorraAngolaAntigua and BarbudaArab WorldArgentinaArmeniaArubaAustraliaAustriaAzerbaijanBahamas, TheBahrainBangladeshBarbadosBelarusBelgiumBelizeBeninBermudaBhutanBoliviaBosnia and HerzegovinaBotswanaBrazilBrunei DarussalamBulgariaBurkina FasoBurundiCabo VerdeCambodiaCameroonCanadaCaribbean small statesCentral African RepublicCentral Europe and the BalticsChadChileChinaColombiaComorosCongo, Dem. Rep.Congo, Rep.Costa RicaCote d'IvoireCroatiaCubaCyprusCzech RepublicDenmarkDjiboutiDominicaDominican RepublicEarly-demographic dividendEast Asia & PacificEast Asia & Pacific (excluding high income)East Asia & Pacific (IDA & IBRD countries)EcuadorEgypt, Arab Rep.El SalvadorEquatorial GuineaEritreaEstoniaEthiopiaEuro areaEurope & Central AsiaEurope & Central Asia (excluding high income)Europe & Central Asia (IDA & IBRD countries)European UnionFijiFinlandFragile and conflict affected situationsFranceGabonGambia, TheGeorgiaGermanyGhanaGreeceGrenadaGuatemalaGuineaGuinea-BissauGuyanaHeavily indebted poor countries (HIPC)High incomeHondurasHong Kong SAR, ChinaHungaryIBRD onlyIcelandIDA & IBRD totalIDA blendIDA onlyIDA totalIndiaIndonesiaIran, Islamic Rep.IraqIrelandIsraelItalyJamaicaJapanJordanKazakhstanKenyaKorea, Dem. People’s Rep.Korea, Rep.KuwaitKyrgyz RepublicLao PDRLate-demographic dividendLatin America & Caribbean Latin America & Caribbean (excluding high income)Latin America & the Caribbean (IDA & IBRD countries)LatviaLeast developed countries: UN classificationLebanonLesothoLiberiaLibyaLiechtensteinLithuaniaLow & middle incomeLow incomeLower middle incomeLuxembourgMacao SAR, ChinaMacedonia, FYRMadagascarMaldivesMaliMaltaMarshall IslandsMauritaniaMauritiusMexicoMicronesia, Fed. Sts.Middle East & North AfricaMiddle East & North Africa (excluding high income)Middle East & North Africa (IDA & IBRD countries)Middle incomeMoldovaMongoliaMontenegroMoroccoMozambiqueMyanmarNamibiaNauruNepalNetherlandsNew ZealandNicaraguaNigerNigeriaNorth AmericaNorwayOECD membersOmanOther small statesPacific island small statesPakistanPalauPanamaPapua New GuineaParaguayPeruPhilippinesPolandPortugalPost-demographic dividendPre-demographic dividendPuerto RicoQatarRomaniaRussian FederationRwandaSamoaSan MarinoSao Tome and PrincipeSaudi ArabiaSenegalSerbiaSeychellesSierra LeoneSlovak RepublicSloveniaSmall statesSolomon IslandsSomaliaSouth AfricaSouth AsiaSouth Asia (IDA & IBRD)South SudanSpainSri LankaSt. Kitts and NevisSt. LuciaSt. Vincent and the GrenadinesSub-Saharan Africa Sub-Saharan Africa (excluding high income)Sub-Saharan Africa (IDA & IBRD countries)SudanSurinameSwazilandSwedenSwitzerlandSyrian Arab RepublicTajikistanTanzaniaThailandTimor-LesteTogoTongaTrinidad and TobagoTunisiaTurkeyTurkmenistanTuvaluUgandaUkraineUnited Arab EmiratesUnited KingdomUnited StatesUpper middle incomeUruguayUzbekistanVanuatuVenezuela, RBVietnamWest Bank and GazaWorldYemen, Rep.Zimbabwe línea de tiempo (timeline):
En esta escala de tiempo se presenta un gráfico de 1975 y 2015 de Bahrain. Los datos de 1974 están ausentes. El número de observaciones reales por fecha: 39.
Fuente (nombre):
Indicadores del desarrollo mundial
Fuente (organización):
UNESCO Institute for Statistics
Categorías:
Education, Gender
Se ha actualizado:
23 abr 2017 año
Los indicadores de los cambios de valor en los últimos años
Mínimo:
5.659
1 ene 1975 año
Máximo:
55.23
1 ene 2015 año
A la fecha de observación
Valor
Cambio absoluto
El cambio con respecto al valor anterior
1 ene 1975 año
5.659
+5.659
0.0%
1 ene 1976 año
6.029
+0.37
6.54%
1 ene 1977 año
8.514
+2.486
41.23%
1 ene 1978 año
11.362
+2.848
33.45%
1 ene 1979 año
9.935
-1.427
-12.56%
1 ene 1980 año
10.543
+0.608
6.12%
1 ene 1981 año
10.942
+0.399
3.79%
1 ene 1982 año
13.425
+2.483
22.69%
1 ene 1983 año
15.28
+1.855
13.81%
1 ene 1984 año
17.262
+1.982
12.97%
1 ene 1985 año
17.523
+0.261
1.51%
1 ene 1986 año
21.444
+3.921
22.38%
1 ene 1987 año
23.85
+2.407
11.22%
1 ene 1988 año
24.462
+0.612
2.57%
1 ene 1989 año
25.217
+0.755
3.09%
1 ene 1990 año
25.432
+0.215
0.85%
1 ene 1992 año
25.082
-0.349
-1.37%
1 ene 1993 año
27.616
+2.534
10.1%
1 ene 1994 año
30.468
+2.852
10.33%
1 ene 1995 año
31.735
+1.267
4.16%
1 ene 1996 año
33.926
+2.191
6.9%
1 ene 1997 año
33.227
-0.699
-2.06%
1 ene 1998 año
32.517
-0.709
-2.14%
1 ene 1999 año
33.97
+1.453
4.47%
1 ene 2000 año
31.904
-2.066
-6.08%
1 ene 2001 año
31.54
-0.364
-1.14%
1 ene 2002 año
31.432
-0.109
-0.34%
1 ene 2003 año
32.885
+1.453
4.62%
1 ene 2004 año
34.7
+1.815
5.52%
1 ene 2005 año
38.28
+3.58
10.32%
1 ene 2006 año
37.923
-0.357
-0.93%
1 ene 2007 año
37.396
-0.527
-1.39%
1 ene 2009 año
44.02
+6.624
17.71%
1 ene 2010 año
48.85
+4.83
10.97%
1 ene 2011 año
50.624
+1.774
3.63%
1 ene 2012 año
52.118
+1.494
2.95%
1 ene 2013 año
50.263
-1.855
-3.56%
1 ene 2014 año
52.622
+2.359
4.69%
1 ene 2015 año
55.23
+2.608
4.96%
Ranking de los países por los datos estadísticos actuales


Comentarios: