29
/es/
es
AIzaSyAYiBZKx7MnpbEhh9jyipgxe19OcubqV5w
April 1, 2024
47166
Lower middle income
LMC
false
2
1
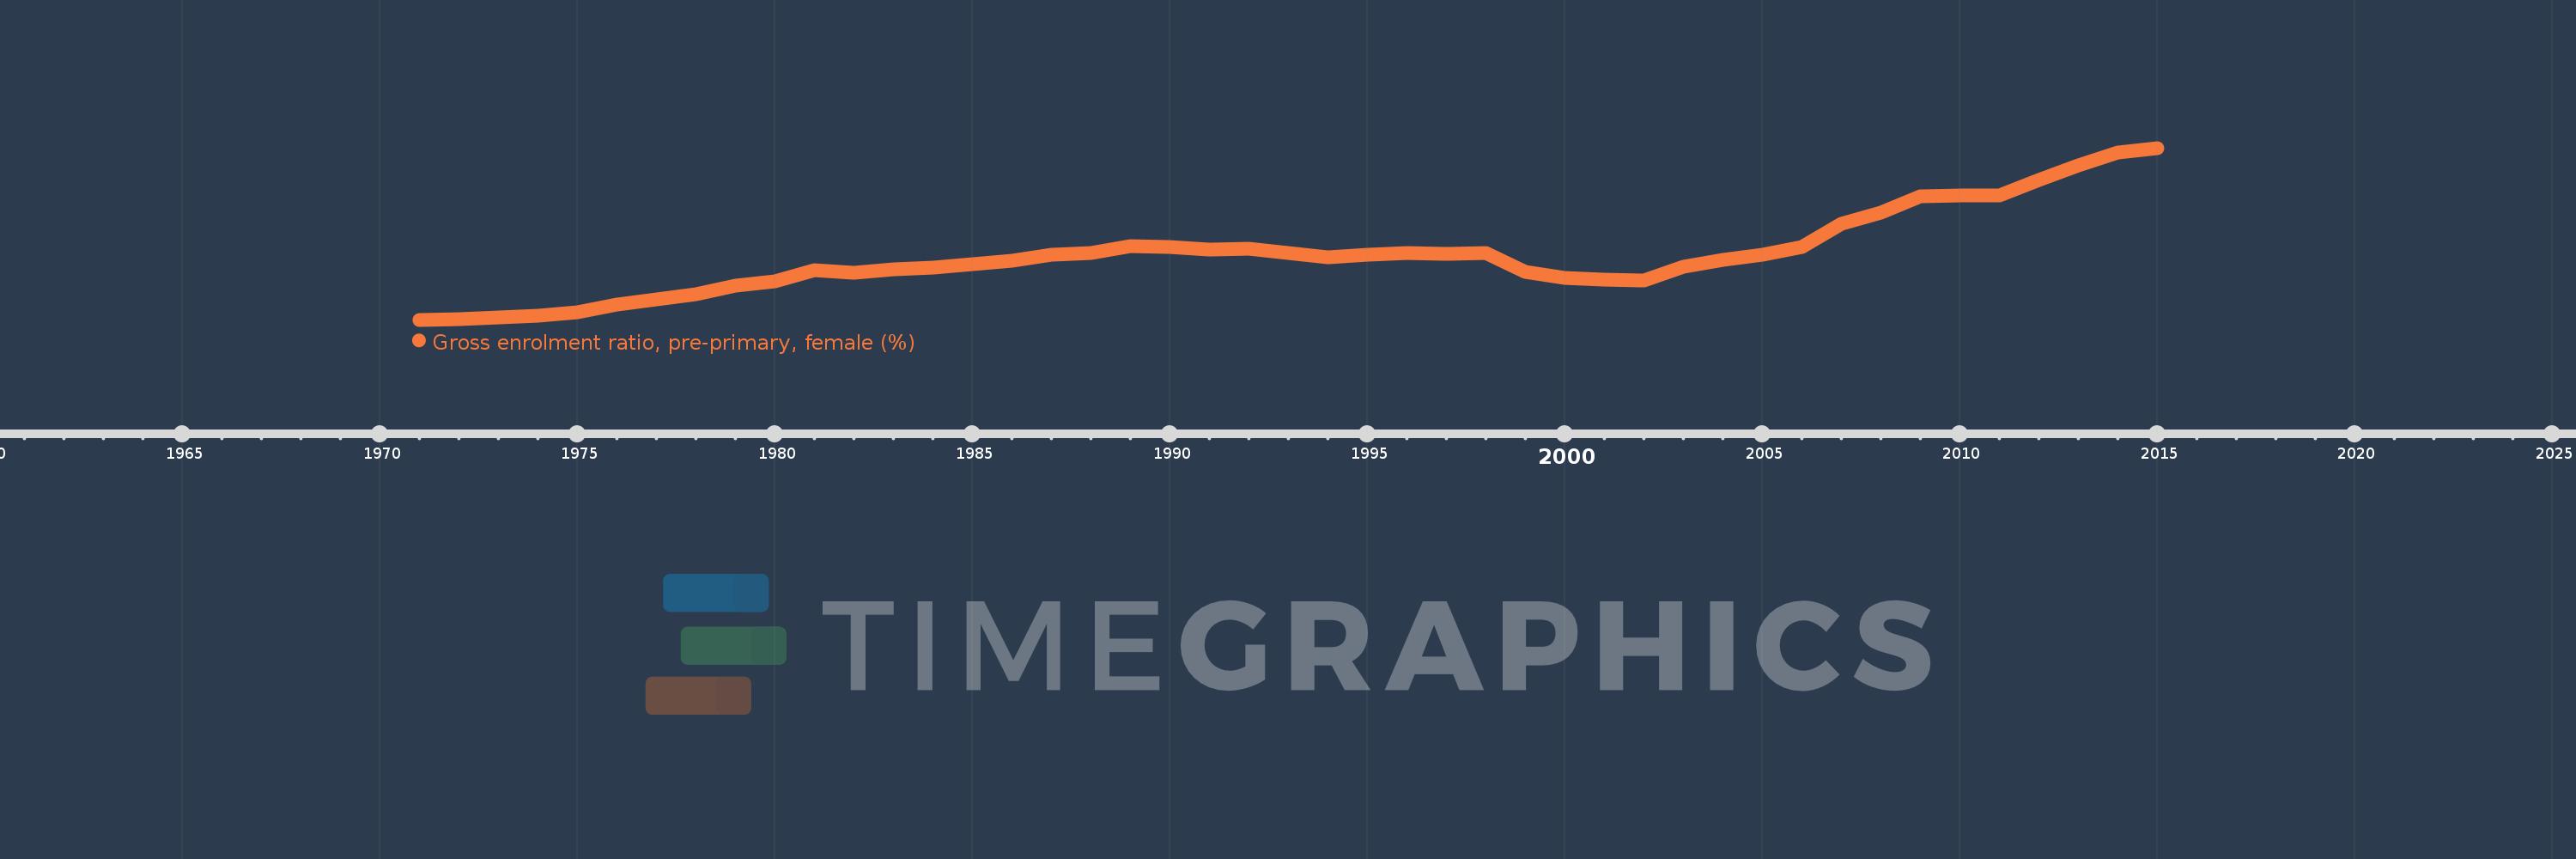
Gross enrolment ratio, pre-primary, female (%)
2015,2014,2013,2012,2011,2010,2009,2008,2007,2006,2005,2004,2003,2002,2001,2000,1999,1998,1997,1996,1995,1994,1993,1992,1991,1990,1989,1988,1987,1986,1985,1984,1983,1982,1981,1980,1979,1978,1977,1976,1975,1974,1973,1972,1971
Estas estadísticas en otros países:
AfghanistanAlbaniaAlgeriaAndorraAngolaAntigua and BarbudaArab WorldArgentinaArmeniaArubaAustraliaAustriaAzerbaijanBahamas, TheBahrainBangladeshBarbadosBelarusBelgiumBelizeBeninBermudaBhutanBoliviaBosnia and HerzegovinaBotswanaBrazilBrunei DarussalamBulgariaBurkina FasoBurundiCabo VerdeCambodiaCameroonCanadaCaribbean small statesCentral African RepublicCentral Europe and the BalticsChadChileChinaColombiaComorosCongo, Dem. Rep.Congo, Rep.Costa RicaCote d'IvoireCroatiaCubaCyprusCzech RepublicDenmarkDjiboutiDominicaDominican RepublicEarly-demographic dividendEast Asia & PacificEast Asia & Pacific (excluding high income)East Asia & Pacific (IDA & IBRD countries)EcuadorEgypt, Arab Rep.El SalvadorEquatorial GuineaEritreaEstoniaEthiopiaEuro areaEurope & Central AsiaEurope & Central Asia (excluding high income)Europe & Central Asia (IDA & IBRD countries)European UnionFijiFinlandFragile and conflict affected situationsFranceGabonGambia, TheGeorgiaGermanyGhanaGreeceGrenadaGuatemalaGuineaGuinea-BissauGuyanaHeavily indebted poor countries (HIPC)High incomeHondurasHong Kong SAR, ChinaHungaryIBRD onlyIcelandIDA & IBRD totalIDA blendIDA onlyIDA totalIndiaIndonesiaIran, Islamic Rep.IraqIrelandIsraelItalyJamaicaJapanJordanKazakhstanKenyaKorea, Dem. People’s Rep.Korea, Rep.KuwaitKyrgyz RepublicLao PDRLate-demographic dividendLatin America & Caribbean Latin America & Caribbean (excluding high income)Latin America & the Caribbean (IDA & IBRD countries)LatviaLeast developed countries: UN classificationLebanonLesothoLiberiaLibyaLiechtensteinLithuaniaLow & middle incomeLow incomeLower middle incomeLuxembourgMacao SAR, ChinaMacedonia, FYRMadagascarMaldivesMaliMaltaMarshall IslandsMauritaniaMauritiusMexicoMicronesia, Fed. Sts.Middle East & North AfricaMiddle East & North Africa (excluding high income)Middle East & North Africa (IDA & IBRD countries)Middle incomeMoldovaMongoliaMontenegroMoroccoMozambiqueMyanmarNamibiaNauruNepalNetherlandsNew ZealandNicaraguaNigerNigeriaNorth AmericaNorwayOECD membersOmanOther small statesPacific island small statesPakistanPalauPanamaPapua New GuineaParaguayPeruPhilippinesPolandPortugalPost-demographic dividendPre-demographic dividendPuerto RicoQatarRomaniaRussian FederationRwandaSamoaSan MarinoSao Tome and PrincipeSaudi ArabiaSenegalSerbiaSeychellesSierra LeoneSlovak RepublicSloveniaSmall statesSolomon IslandsSomaliaSouth AfricaSouth AsiaSouth Asia (IDA & IBRD)South SudanSpainSri LankaSt. Kitts and NevisSt. LuciaSt. Vincent and the GrenadinesSub-Saharan Africa Sub-Saharan Africa (excluding high income)Sub-Saharan Africa (IDA & IBRD countries)SudanSurinameSwazilandSwedenSwitzerlandSyrian Arab RepublicTajikistanTanzaniaThailandTimor-LesteTogoTongaTrinidad and TobagoTunisiaTurkeyTurkmenistanTuvaluUgandaUkraineUnited Arab EmiratesUnited KingdomUnited StatesUpper middle incomeUruguayUzbekistanVanuatuVenezuela, RBVietnamWest Bank and GazaWorldYemen, Rep.Zimbabwe línea de tiempo (timeline):
En esta escala de tiempo se presenta un gráfico de 1971 y 2015 de Lower middle income. Los datos de 1970 están ausentes. El número de observaciones reales por fecha: 45.
Fuente (nombre):
Indicadores del desarrollo mundial
Fuente (organización):
UNESCO Institute for Statistics
Categorías:
Education, Gender
Se ha actualizado:
23 abr 2017 año
Los indicadores de los cambios de valor en los últimos años
Mínimo:
10.501
1 ene 1971 año
Máximo:
25.896
1 ene 2015 año
A la fecha de observación
Valor
Cambio absoluto
El cambio con respecto al valor anterior
1 ene 1971 año
10.501
+10.501
0.0%
1 ene 1972 año
10.542
+0.041
0.39%
1 ene 1973 año
10.691
+0.148
1.41%
1 ene 1974 año
10.853
+0.162
1.52%
1 ene 1975 año
11.145
+0.293
2.7%
1 ene 1976 año
11.88
+0.734
6.59%
1 ene 1977 año
12.296
+0.416
3.5%
1 ene 1978 año
12.825
+0.53
4.31%
1 ene 1979 año
13.552
+0.727
5.67%
1 ene 1980 año
13.955
+0.403
2.98%
1 ene 1981 año
14.969
+1.013
7.26%
1 ene 1982 año
14.748
-0.221
-1.48%
1 ene 1983 año
15.02
+0.273
1.85%
1 ene 1984 año
15.157
+0.136
0.91%
1 ene 1985 año
15.511
+0.355
2.34%
1 ene 1986 año
15.767
+0.256
1.65%
1 ene 1987 año
16.317
+0.55
3.49%
1 ene 1988 año
16.476
+0.159
0.97%
1 ene 1989 año
17.109
+0.632
3.84%
1 ene 1990 año
17.02
-0.088
-0.52%
1 ene 1991 año
16.821
-0.199
-1.17%
1 ene 1992 año
16.841
+0.02
0.12%
1 ene 1993 año
16.49
-0.351
-2.08%
1 ene 1994 año
16.062
-0.428
-2.6%
1 ene 1995 año
16.301
+0.239
1.49%
1 ene 1996 año
16.47
+0.169
1.04%
1 ene 1997 año
16.386
-0.084
-0.51%
1 ene 1998 año
16.507
+0.121
0.74%
1 ene 1999 año
14.766
-1.74
-10.54%
1 ene 2000 año
14.254
-0.512
-3.47%
1 ene 2001 año
14.124
-0.131
-0.92%
1 ene 2002 año
13.992
-0.132
-0.93%
1 ene 2003 año
15.283
+1.291
9.23%
1 ene 2004 año
15.889
+0.606
3.96%
1 ene 2005 año
16.323
+0.435
2.74%
1 ene 2006 año
17.003
+0.68
4.17%
1 ene 2007 año
19.087
+2.083
12.25%
1 ene 2008 año
20.096
+1.009
5.29%
1 ene 2009 año
21.558
+1.462
7.27%
1 ene 2010 año
21.604
+0.046
0.21%
1 ene 2011 año
21.669
+0.065
0.3%
1 ene 2012 año
23.053
+1.384
6.39%
1 ene 2013 año
24.326
+1.273
5.52%
1 ene 2014 año
25.462
+1.136
4.67%
1 ene 2015 año
25.896
+0.434
1.71%
Ranking de los países por los datos estadísticos actuales


Comentarios: