29
/es/
es
AIzaSyAYiBZKx7MnpbEhh9jyipgxe19OcubqV5w
April 1, 2024
46140
Low income
LIC
false
2
1
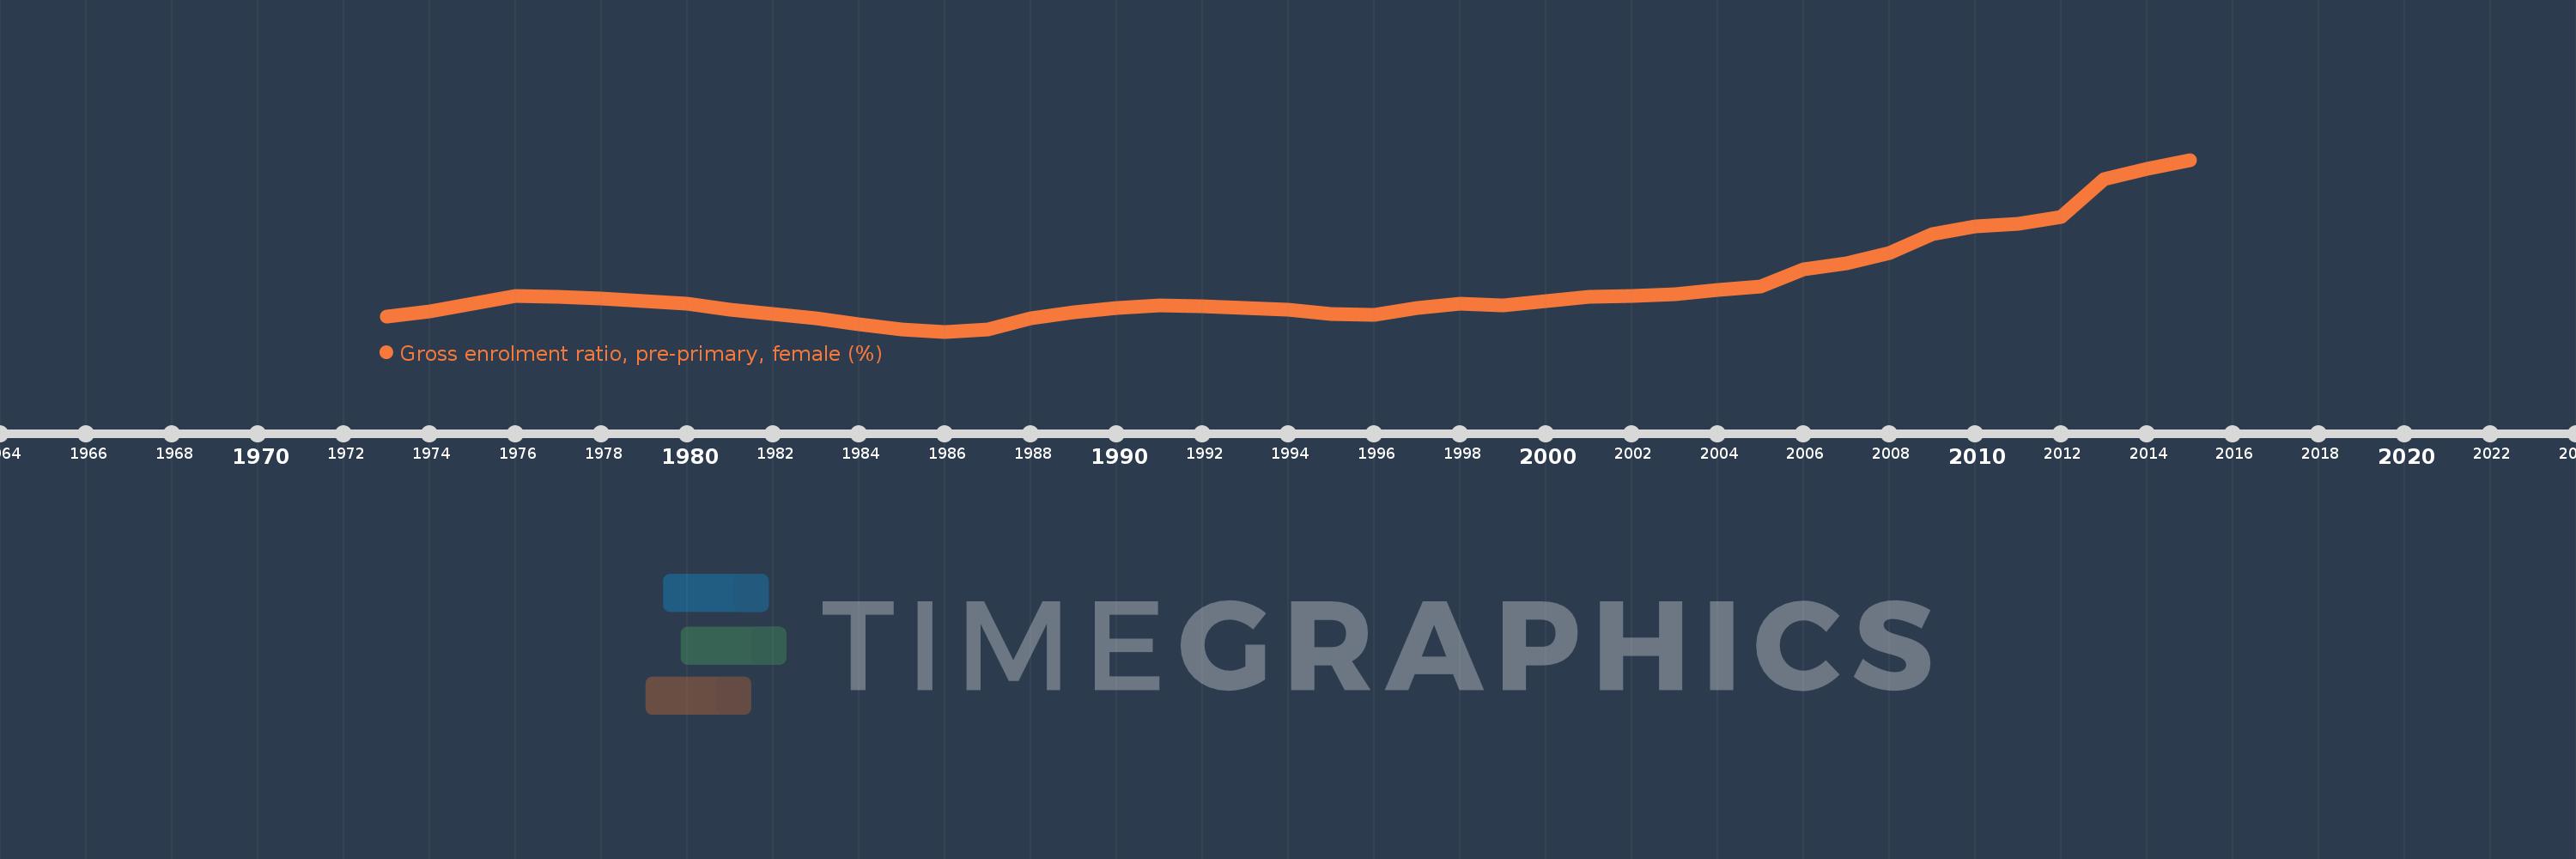
Gross enrolment ratio, pre-primary, female (%)
2015,2014,2013,2012,2011,2010,2009,2008,2007,2006,2005,2004,2003,2002,2001,2000,1999,1998,1997,1996,1995,1994,1993,1992,1991,1990,1989,1988,1987,1986,1985,1984,1983,1982,1981,1980,1979,1978,1977,1976,1975,1974,1973
Estas estadísticas en otros países:
AfghanistanAlbaniaAlgeriaAndorraAngolaAntigua and BarbudaArab WorldArgentinaArmeniaArubaAustraliaAustriaAzerbaijanBahamas, TheBahrainBangladeshBarbadosBelarusBelgiumBelizeBeninBermudaBhutanBoliviaBosnia and HerzegovinaBotswanaBrazilBrunei DarussalamBulgariaBurkina FasoBurundiCabo VerdeCambodiaCameroonCanadaCaribbean small statesCentral African RepublicCentral Europe and the BalticsChadChileChinaColombiaComorosCongo, Dem. Rep.Congo, Rep.Costa RicaCote d'IvoireCroatiaCubaCyprusCzech RepublicDenmarkDjiboutiDominicaDominican RepublicEarly-demographic dividendEast Asia & PacificEast Asia & Pacific (excluding high income)East Asia & Pacific (IDA & IBRD countries)EcuadorEgypt, Arab Rep.El SalvadorEquatorial GuineaEritreaEstoniaEthiopiaEuro areaEurope & Central AsiaEurope & Central Asia (excluding high income)Europe & Central Asia (IDA & IBRD countries)European UnionFijiFinlandFragile and conflict affected situationsFranceGabonGambia, TheGeorgiaGermanyGhanaGreeceGrenadaGuatemalaGuineaGuinea-BissauGuyanaHeavily indebted poor countries (HIPC)High incomeHondurasHong Kong SAR, ChinaHungaryIBRD onlyIcelandIDA & IBRD totalIDA blendIDA onlyIDA totalIndiaIndonesiaIran, Islamic Rep.IraqIrelandIsraelItalyJamaicaJapanJordanKazakhstanKenyaKorea, Dem. People’s Rep.Korea, Rep.KuwaitKyrgyz RepublicLao PDRLate-demographic dividendLatin America & Caribbean Latin America & Caribbean (excluding high income)Latin America & the Caribbean (IDA & IBRD countries)LatviaLeast developed countries: UN classificationLebanonLesothoLiberiaLibyaLiechtensteinLithuaniaLow & middle incomeLow incomeLower middle incomeLuxembourgMacao SAR, ChinaMacedonia, FYRMadagascarMaldivesMaliMaltaMarshall IslandsMauritaniaMauritiusMexicoMicronesia, Fed. Sts.Middle East & North AfricaMiddle East & North Africa (excluding high income)Middle East & North Africa (IDA & IBRD countries)Middle incomeMoldovaMongoliaMontenegroMoroccoMozambiqueMyanmarNamibiaNauruNepalNetherlandsNew ZealandNicaraguaNigerNigeriaNorth AmericaNorwayOECD membersOmanOther small statesPacific island small statesPakistanPalauPanamaPapua New GuineaParaguayPeruPhilippinesPolandPortugalPost-demographic dividendPre-demographic dividendPuerto RicoQatarRomaniaRussian FederationRwandaSamoaSan MarinoSao Tome and PrincipeSaudi ArabiaSenegalSerbiaSeychellesSierra LeoneSlovak RepublicSloveniaSmall statesSolomon IslandsSomaliaSouth AfricaSouth AsiaSouth Asia (IDA & IBRD)South SudanSpainSri LankaSt. Kitts and NevisSt. LuciaSt. Vincent and the GrenadinesSub-Saharan Africa Sub-Saharan Africa (excluding high income)Sub-Saharan Africa (IDA & IBRD countries)SudanSurinameSwazilandSwedenSwitzerlandSyrian Arab RepublicTajikistanTanzaniaThailandTimor-LesteTogoTongaTrinidad and TobagoTunisiaTurkeyTurkmenistanTuvaluUgandaUkraineUnited Arab EmiratesUnited KingdomUnited StatesUpper middle incomeUruguayUzbekistanVanuatuVenezuela, RBVietnamWest Bank and GazaWorldYemen, Rep.Zimbabwe línea de tiempo (timeline):
En esta escala de tiempo se presenta un gráfico de 1973 y 2015 de Low income. Los datos de 1972 están ausentes. El número de observaciones reales por fecha: 43.
Fuente (nombre):
Indicadores del desarrollo mundial
Fuente (organización):
UNESCO Institute for Statistics
Categorías:
Education, Gender
Se ha actualizado:
23 abr 2017 año
Los indicadores de los cambios de valor en los últimos años
Mínimo:
7.14
1 ene 1986 año
Máximo:
17.047
1 ene 2015 año
A la fecha de observación
Valor
Cambio absoluto
El cambio con respecto al valor anterior
1 ene 1973 año
7.984
+7.984
0.0%
1 ene 1974 año
8.317
+0.334
4.18%
1 ene 1975 año
8.741
+0.424
5.09%
1 ene 1976 año
9.201
+0.461
5.27%
1 ene 1977 año
9.136
-0.065
-0.71%
1 ene 1978 año
9.052
-0.085
-0.93%
1 ene 1979 año
8.906
-0.146
-1.61%
1 ene 1980 año
8.727
-0.178
-2.0%
1 ene 1981 año
8.399
-0.328
-3.76%
1 ene 1982 año
8.174
-0.225
-2.68%
1 ene 1983 año
7.917
-0.257
-3.15%
1 ene 1984 año
7.551
-0.366
-4.62%
1 ene 1985 año
7.255
-0.296
-3.92%
1 ene 1986 año
7.14
-0.115
-1.59%
1 ene 1987 año
7.277
+0.137
1.92%
1 ene 1988 año
7.916
+0.639
8.78%
1 ene 1989 año
8.244
+0.329
4.15%
1 ene 1990 año
8.514
+0.27
3.27%
1 ene 1991 año
8.675
+0.161
1.89%
1 ene 1992 año
8.62
-0.055
-0.64%
1 ene 1993 año
8.501
-0.119
-1.38%
1 ene 1994 año
8.386
-0.115
-1.36%
1 ene 1995 año
8.151
-0.235
-2.8%
1 ene 1996 año
8.125
-0.026
-0.32%
1 ene 1997 año
8.48
+0.355
4.37%
1 ene 1998 año
8.769
+0.29
3.42%
1 ene 1999 año
8.647
-0.123
-1.4%
1 ene 2000 año
8.886
+0.24
2.77%
1 ene 2001 año
9.165
+0.279
3.14%
1 ene 2002 año
9.205
+0.039
0.43%
1 ene 2003 año
9.308
+0.103
1.12%
1 ene 2004 año
9.525
+0.217
2.33%
1 ene 2005 año
9.728
+0.202
2.13%
1 ene 2006 año
10.74
+1.012
10.41%
1 ene 2007 año
11.099
+0.359
3.34%
1 ene 2008 año
11.692
+0.593
5.34%
1 ene 2009 año
12.764
+1.073
9.18%
1 ene 2010 año
13.222
+0.457
3.58%
1 ene 2011 año
13.378
+0.156
1.18%
1 ene 2012 año
13.772
+0.393
2.94%
1 ene 2013 año
15.925
+2.153
15.63%
1 ene 2014 año
16.507
+0.583
3.66%
1 ene 2015 año
17.047
+0.54
3.27%
Ranking de los países por los datos estadísticos actuales


Comentarios: