30
/es/
AIzaSyAYiBZKx7MnpbEhh9jyipgxe19OcubqV5w
April 1, 2024
77124
Bahrain
BHR
true
2
1
GDP, PPP (constant 2011 international $)
2016,2015,2014,2013,2012,2011,2010,2009,2008,2007,2006,2005,2004,2003,2002,2001,2000,1999,1998,1997,1996,1995,1994,1993,1992,1991
Download
Estadísticas Globales de la Biblioteca →Bahrain →

GDP, PPP (constant 2011 international $)

Estas estadísticas en otros países:

AfghanistanAlbaniaAlgeriaAngolaAntigua and BarbudaArab WorldArgentinaArmeniaArubaAustraliaAustriaAzerbaijanBahamas, TheBahrainBangladeshBarbadosBelarusBelgiumBelizeBeninBermudaBhutanBoliviaBosnia and HerzegovinaBotswanaBrazilBrunei DarussalamBulgariaBurkina FasoBurundiCabo VerdeCambodiaCameroonCanadaCaribbean small statesCayman IslandsCentral African RepublicCentral Europe and the BalticsChadChileChinaColombiaComorosCongo, Dem. Rep.Congo, Rep.Costa RicaCote d'IvoireCroatiaCubaCyprusCzech RepublicDenmarkDjiboutiDominicaDominican RepublicEarly-demographic dividendEast Asia & PacificEast Asia & Pacific (excluding high income)East Asia & Pacific (IDA & IBRD countries)EcuadorEgypt, Arab Rep.El SalvadorEquatorial GuineaEritreaEstoniaEthiopiaEuro areaEurope & Central AsiaEurope & Central Asia (excluding high income)Europe & Central Asia (IDA & IBRD countries)European UnionFijiFinlandFragile and conflict affected situationsFranceGabonGambia, TheGeorgiaGermanyGhanaGreeceGrenadaGuatemalaGuineaGuinea-BissauGuyanaHaitiHeavily indebted poor countries (HIPC)High incomeHondurasHong Kong SAR, ChinaHungaryIBRD onlyIcelandIDA & IBRD totalIDA blendIDA onlyIDA totalIndiaIndonesiaIran, Islamic Rep.IraqIrelandIsraelItalyJamaicaJapanJordanKazakhstanKenyaKiribatiKorea, Rep.KosovoKuwaitKyrgyz RepublicLao PDRLate-demographic dividendLatin America & Caribbean Latin America & Caribbean (excluding high income)Latin America & the Caribbean (IDA & IBRD countries)LatviaLeast developed countries: UN classificationLebanonLesothoLiberiaLibyaLithuaniaLow & middle incomeLow incomeLower middle incomeLuxembourgMacao SAR, ChinaMacedonia, FYRMadagascarMalawiMalaysiaMaldivesMaliMaltaMarshall IslandsMauritaniaMauritiusMexicoMicronesia, Fed. Sts.Middle East & North AfricaMiddle East & North Africa (excluding high income)Middle East & North Africa (IDA & IBRD countries)Middle incomeMoldovaMongoliaMontenegroMoroccoMozambiqueMyanmarNamibiaNauruNepalNetherlandsNew ZealandNicaraguaNigerNigeriaNorth AmericaNorwayOECD membersOmanOther small statesPacific island small statesPakistanPalauPanamaPapua New GuineaParaguayPeruPhilippinesPolandPortugalPost-demographic dividendPre-demographic dividendPuerto RicoQatarRomaniaRussian FederationRwandaSamoaSao Tome and PrincipeSaudi ArabiaSenegalSerbiaSeychellesSierra LeoneSingaporeSint Maarten (Dutch part)Slovak RepublicSloveniaSmall statesSolomon IslandsSouth AfricaSouth AsiaSouth Asia (IDA & IBRD)South SudanSpainSri LankaSt. Kitts and NevisSt. LuciaSt. Vincent and the GrenadinesSub-Saharan Africa Sub-Saharan Africa (excluding high income)Sub-Saharan Africa (IDA & IBRD countries)SudanSurinameSwazilandSwedenSwitzerlandTajikistanTanzaniaThailandTimor-LesteTogoTongaTrinidad and TobagoTunisiaTurkeyTurkmenistanTuvaluUgandaUkraineUnited Arab EmiratesUnited KingdomUnited StatesUpper middle incomeUruguayUzbekistanVanuatuVenezuela, RBVietnamWest Bank and GazaWorldYemen, Rep.ZambiaZimbabwe

línea de tiempo (timeline):

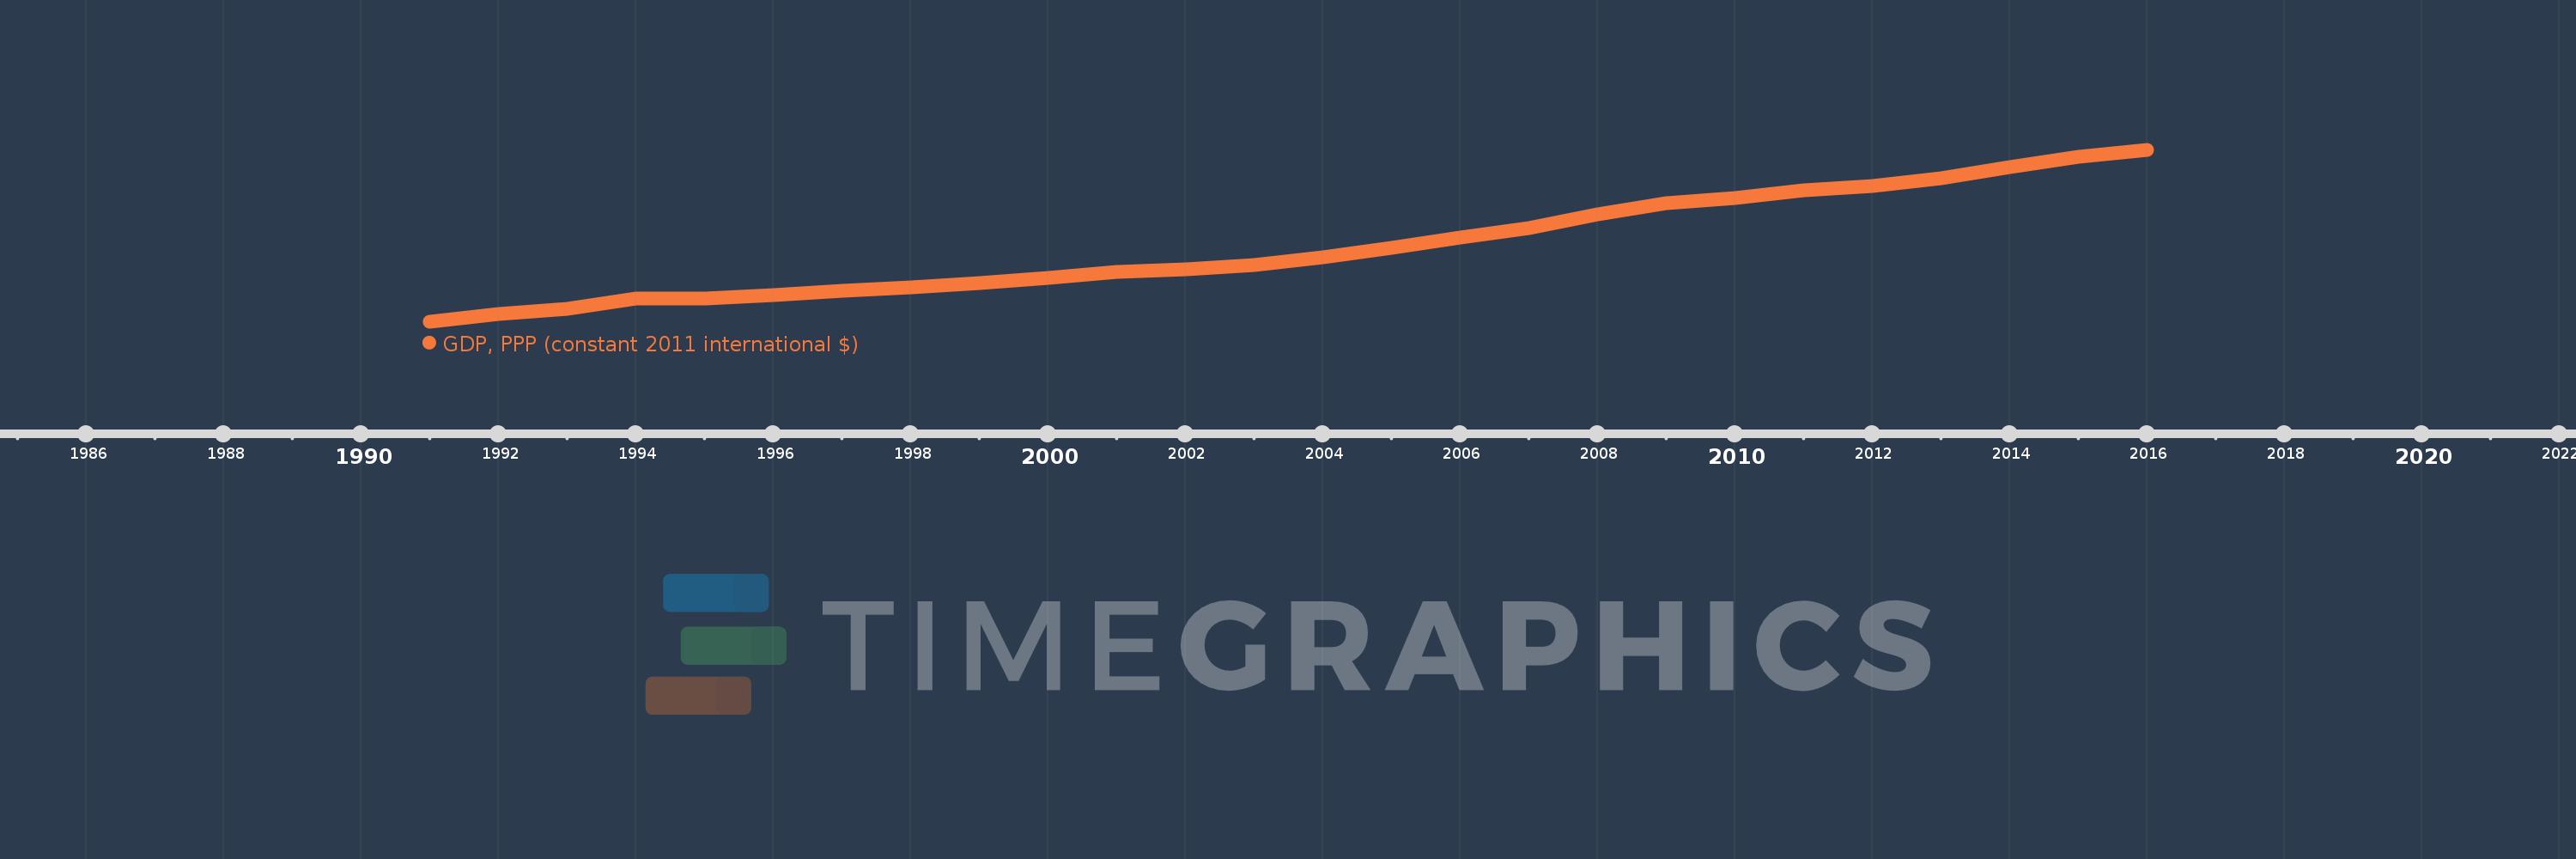
En esta escala de tiempo se presenta un gráfico de 1991 y 2016 de Bahrain. Los datos de 1990 están ausentes. El número de observaciones reales por fecha: 26.

Fuente (nombre):

Indicadores del desarrollo mundial

Fuente (organización):

World Bank, International Comparison Program database.

Categorías:

Economy & Growth

Se ha actualizado:

23 abr 2017 año

Los indicadores de los cambios de valor en los últimos años

En promedio:
36.367 bn
Mínimo:
17.414 bn
1 ene 1991 año
Máximo:
60.259 bn
1 ene 2016 año
A la fecha de observación
Valor
Cambio absoluto
El cambio con respecto al valor anterior
1 ene 1991 año
17.414 bn
+17.414 bn
0.0%
1 ene 1992 año
19.369 bn
+1.956 bn
11.23%
1 ene 1993 año
20.665 bn
+1.296 bn
6.69%
1 ene 1994 año
23.325 bn
+2.66 bn
12.87%
1 ene 1995 año
23.267 bn
-58.313 millones
-0.25%
1 ene 1996 año
24.181 bn
+914.374 millones
3.93%
1 ene 1997 año
25.175 bn
+993.838 millones
4.11%
1 ene 1998 año
25.953 bn
+778.656 millones
3.09%
1 ene 1999 año
27.197 bn
+1.243 bn
4.79%
1 ene 2000 año
28.366 bn
+1.169 bn
4.3%
1 ene 2001 año
29.869 bn
+1.503 bn
5.3%
1 ene 2002 año
30.614 bn
+744.058 millones
2.49%
1 ene 2003 año
31.72 bn
+1.106 bn
3.61%
1 ene 2004 año
33.631 bn
+1.911 bn
6.02%
1 ene 2005 año
35.978 bn
+2.348 bn
6.98%
1 ene 2006 año
38.414 bn
+2.435 bn
6.77%
1 ene 2007 año
40.899 bn
+2.485 bn
6.47%
1 ene 2008 año
44.29 bn
+3.391 bn
8.29%
1 ene 2009 año
47.056 bn
+2.766 bn
6.25%
1 ene 2010 año
48.251 bn
+1.195 bn
2.54%
1 ene 2011 año
50.343 bn
+2.091 bn
4.33%
1 ene 2012 año
51.341 bn
+998.501 millones
1.98%
1 ene 2013 año
53.255 bn
+1.914 bn
3.73%
1 ene 2014 año
56.14 bn
+2.885 bn
5.42%
1 ene 2015 año
58.582 bn
+2.442 bn
4.35%
1 ene 2016 año
60.259 bn
+1.677 bn
2.86%

Ranking de los países por los datos estadísticos actuales