30
/es/
AIzaSyAYiBZKx7MnpbEhh9jyipgxe19OcubqV5w
April 1, 2024
167500
Kenya
KEN
true
2
1
GDP, PPP (constant 2011 international $)
2016,2015,2014,2013,2012,2011,2010,2009,2008,2007,2006,2005,2004,2003,2002,2001,2000,1999,1998,1997,1996,1995,1994,1993,1992,1991
Download
Estadísticas Globales de la Biblioteca →Kenya →

GDP, PPP (constant 2011 international $)

Estas estadísticas en otros países:

AfghanistanAlbaniaAlgeriaAngolaAntigua and BarbudaArab WorldArgentinaArmeniaArubaAustraliaAustriaAzerbaijanBahamas, TheBahrainBangladeshBarbadosBelarusBelgiumBelizeBeninBermudaBhutanBoliviaBosnia and HerzegovinaBotswanaBrazilBrunei DarussalamBulgariaBurkina FasoBurundiCabo VerdeCambodiaCameroonCanadaCaribbean small statesCayman IslandsCentral African RepublicCentral Europe and the BalticsChadChileChinaColombiaComorosCongo, Dem. Rep.Congo, Rep.Costa RicaCote d'IvoireCroatiaCubaCyprusCzech RepublicDenmarkDjiboutiDominicaDominican RepublicEarly-demographic dividendEast Asia & PacificEast Asia & Pacific (excluding high income)East Asia & Pacific (IDA & IBRD countries)EcuadorEgypt, Arab Rep.El SalvadorEquatorial GuineaEritreaEstoniaEthiopiaEuro areaEurope & Central AsiaEurope & Central Asia (excluding high income)Europe & Central Asia (IDA & IBRD countries)European UnionFijiFinlandFragile and conflict affected situationsFranceGabonGambia, TheGeorgiaGermanyGhanaGreeceGrenadaGuatemalaGuineaGuinea-BissauGuyanaHaitiHeavily indebted poor countries (HIPC)High incomeHondurasHong Kong SAR, ChinaHungaryIBRD onlyIcelandIDA & IBRD totalIDA blendIDA onlyIDA totalIndiaIndonesiaIran, Islamic Rep.IraqIrelandIsraelItalyJamaicaJapanJordanKazakhstanKenyaKiribatiKorea, Rep.KosovoKuwaitKyrgyz RepublicLao PDRLate-demographic dividendLatin America & Caribbean Latin America & Caribbean (excluding high income)Latin America & the Caribbean (IDA & IBRD countries)LatviaLeast developed countries: UN classificationLebanonLesothoLiberiaLibyaLithuaniaLow & middle incomeLow incomeLower middle incomeLuxembourgMacao SAR, ChinaMacedonia, FYRMadagascarMalawiMalaysiaMaldivesMaliMaltaMarshall IslandsMauritaniaMauritiusMexicoMicronesia, Fed. Sts.Middle East & North AfricaMiddle East & North Africa (excluding high income)Middle East & North Africa (IDA & IBRD countries)Middle incomeMoldovaMongoliaMontenegroMoroccoMozambiqueMyanmarNamibiaNauruNepalNetherlandsNew ZealandNicaraguaNigerNigeriaNorth AmericaNorwayOECD membersOmanOther small statesPacific island small statesPakistanPalauPanamaPapua New GuineaParaguayPeruPhilippinesPolandPortugalPost-demographic dividendPre-demographic dividendPuerto RicoQatarRomaniaRussian FederationRwandaSamoaSao Tome and PrincipeSaudi ArabiaSenegalSerbiaSeychellesSierra LeoneSingaporeSint Maarten (Dutch part)Slovak RepublicSloveniaSmall statesSolomon IslandsSouth AfricaSouth AsiaSouth Asia (IDA & IBRD)South SudanSpainSri LankaSt. Kitts and NevisSt. LuciaSt. Vincent and the GrenadinesSub-Saharan Africa Sub-Saharan Africa (excluding high income)Sub-Saharan Africa (IDA & IBRD countries)SudanSurinameSwazilandSwedenSwitzerlandTajikistanTanzaniaThailandTimor-LesteTogoTongaTrinidad and TobagoTunisiaTurkeyTurkmenistanTuvaluUgandaUkraineUnited Arab EmiratesUnited KingdomUnited StatesUpper middle incomeUruguayUzbekistanVanuatuVenezuela, RBVietnamWest Bank and GazaWorldYemen, Rep.ZambiaZimbabwe

línea de tiempo (timeline):

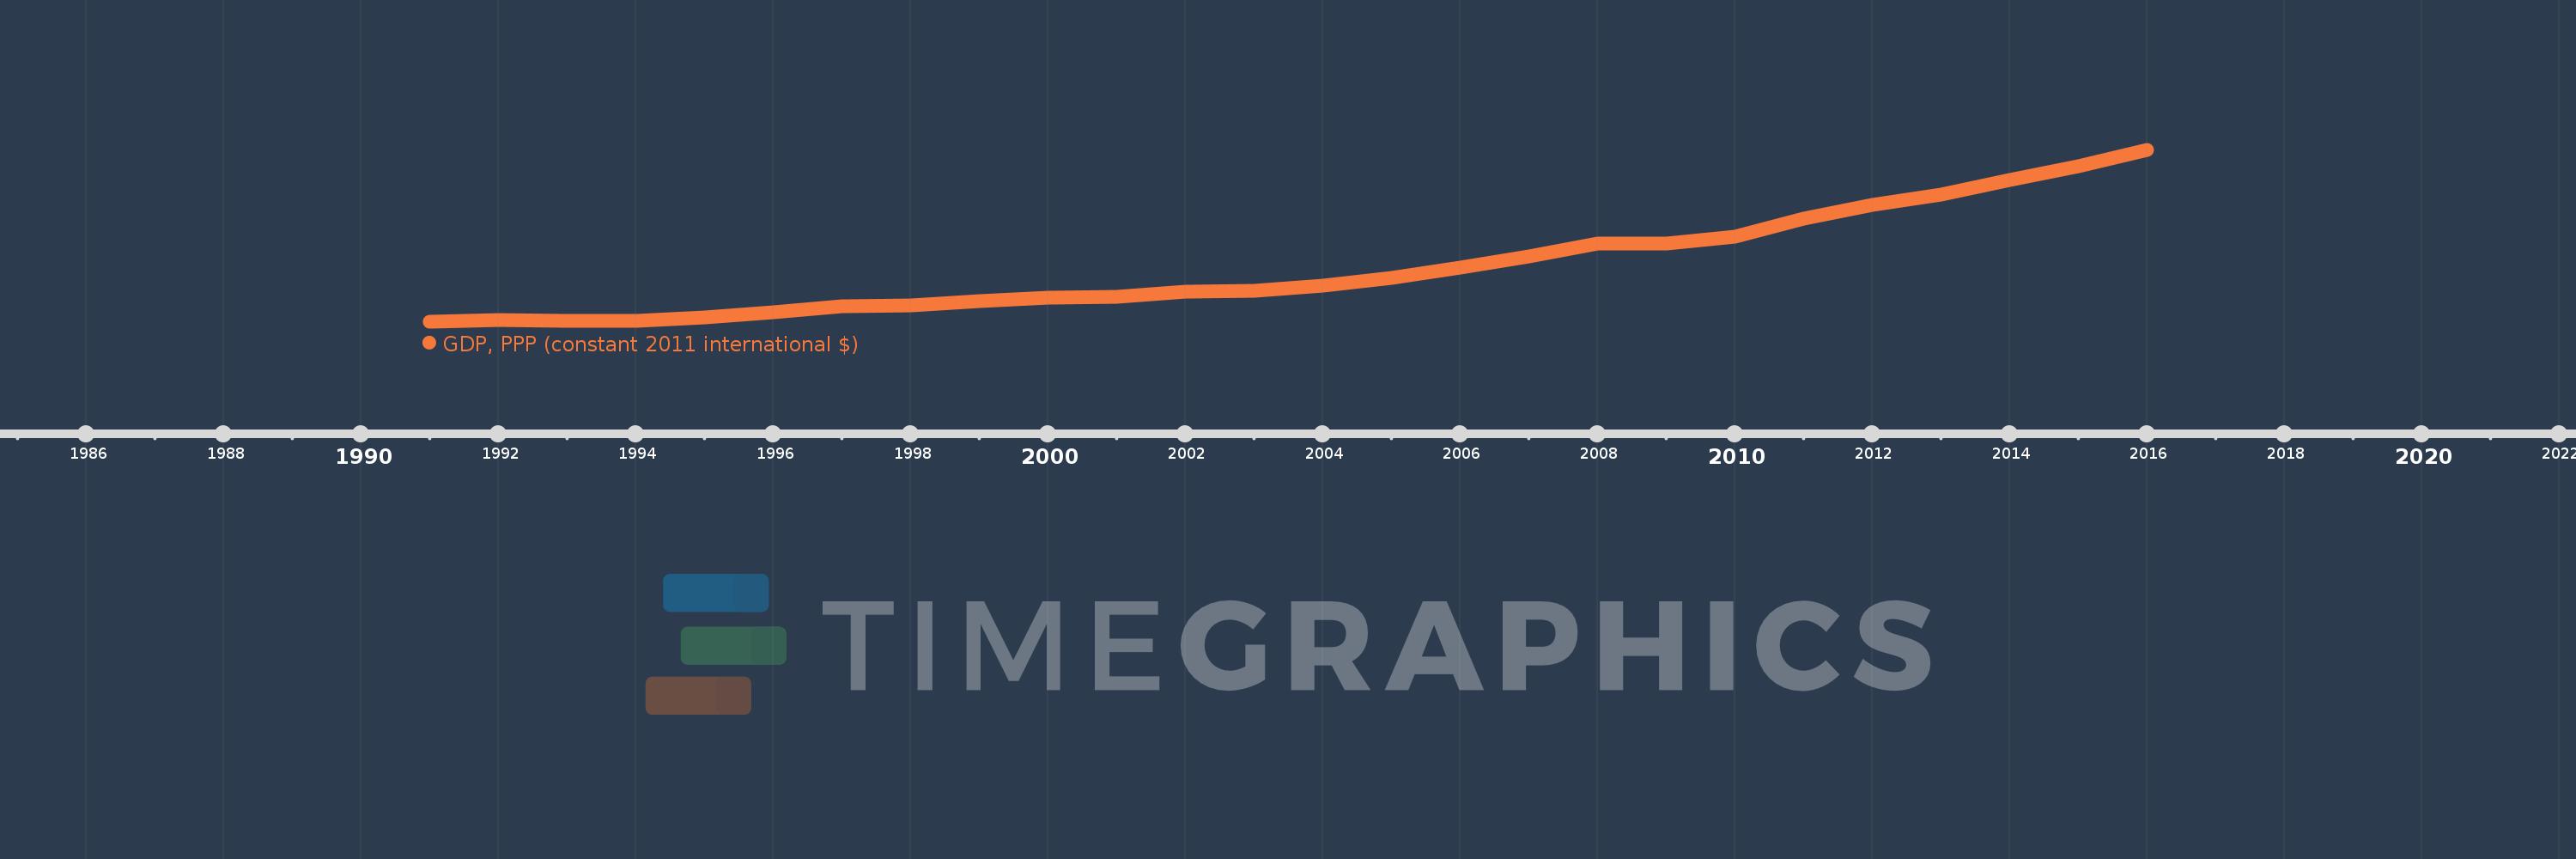
En esta escala de tiempo se presenta un gráfico de 1991 y 2016 de Kenya. Los datos de 1990 están ausentes. El número de observaciones reales por fecha: 26.

Fuente (nombre):

Indicadores del desarrollo mundial

Fuente (organización):

World Bank, International Comparison Program database.

Categorías:

Economy & Growth

Se ha actualizado:

23 abr 2017 año

Los indicadores de los cambios de valor en los últimos años

En promedio:
80.839 bn
Mínimo:
55.708 bn
1 ene 1991 año
Máximo:
133.593 bn
1 ene 2016 año
A la fecha de observación
Valor
Cambio absoluto
El cambio con respecto al valor anterior
1 ene 1991 año
55.708 bn
+55.708 bn
0.0%
1 ene 1992 año
56.509 bn
+801.268 millones
1.44%
1 ene 1993 año
56.057 bn
-451.785 millones
-0.8%
1 ene 1994 año
56.255 bn
+197.992 millones
0.35%
1 ene 1995 año
57.736 bn
+1.481 bn
2.63%
1 ene 1996 año
60.28 bn
+2.544 bn
4.41%
1 ene 1997 año
62.78 bn
+2.5 bn
4.15%
1 ene 1998 año
63.078 bn
+298.142 millones
0.47%
1 ene 1999 año
65.153 bn
+2.075 bn
3.29%
1 ene 2000 año
66.655 bn
+1.502 bn
2.31%
1 ene 2001 año
67.055 bn
+399.729 millones
0.6%
1 ene 2002 año
69.59 bn
+2.535 bn
3.78%
1 ene 2003 año
69.97 bn
+380.558 millones
0.55%
1 ene 2004 año
72.022 bn
+2.052 bn
2.93%
1 ene 2005 año
75.698 bn
+3.676 bn
5.1%
1 ene 2006 año
80.17 bn
+4.471 bn
5.91%
1 ene 2007 año
85.359 bn
+5.189 bn
6.47%
1 ene 2008 año
91.206 bn
+5.848 bn
6.85%
1 ene 2009 año
91.418 bn
+211.856 millones
0.23%
1 ene 2010 año
94.441 bn
+3.023 bn
3.31%
1 ene 2011 año
102.377 bn
+7.935 bn
8.4%
1 ene 2012 año
108.633 bn
+6.257 bn
6.11%
1 ene 2013 año
113.582 bn
+4.948 bn
4.55%
1 ene 2014 año
120.048 bn
+6.467 bn
5.69%
1 ene 2015 año
126.449 bn
+6.401 bn
5.33%
1 ene 2016 año
133.593 bn
+7.143 bn
5.65%

Ranking de los países por los datos estadísticos actuales