30
/es/
AIzaSyAYiBZKx7MnpbEhh9jyipgxe19OcubqV5w
April 1, 2024
214317
Norway
NOR
true
2
1
GDP, PPP (constant 2011 international $)
2016,2015,2014,2013,2012,2011,2010,2009,2008,2007,2006,2005,2004,2003,2002,2001,2000,1999,1998,1997,1996,1995,1994,1993,1992,1991
Download
Estadísticas Globales de la Biblioteca →Norway →

GDP, PPP (constant 2011 international $)

Estas estadísticas en otros países:

AfghanistanAlbaniaAlgeriaAngolaAntigua and BarbudaArab WorldArgentinaArmeniaArubaAustraliaAustriaAzerbaijanBahamas, TheBahrainBangladeshBarbadosBelarusBelgiumBelizeBeninBermudaBhutanBoliviaBosnia and HerzegovinaBotswanaBrazilBrunei DarussalamBulgariaBurkina FasoBurundiCabo VerdeCambodiaCameroonCanadaCaribbean small statesCayman IslandsCentral African RepublicCentral Europe and the BalticsChadChileChinaColombiaComorosCongo, Dem. Rep.Congo, Rep.Costa RicaCote d'IvoireCroatiaCubaCyprusCzech RepublicDenmarkDjiboutiDominicaDominican RepublicEarly-demographic dividendEast Asia & PacificEast Asia & Pacific (excluding high income)East Asia & Pacific (IDA & IBRD countries)EcuadorEgypt, Arab Rep.El SalvadorEquatorial GuineaEritreaEstoniaEthiopiaEuro areaEurope & Central AsiaEurope & Central Asia (excluding high income)Europe & Central Asia (IDA & IBRD countries)European UnionFijiFinlandFragile and conflict affected situationsFranceGabonGambia, TheGeorgiaGermanyGhanaGreeceGrenadaGuatemalaGuineaGuinea-BissauGuyanaHaitiHeavily indebted poor countries (HIPC)High incomeHondurasHong Kong SAR, ChinaHungaryIBRD onlyIcelandIDA & IBRD totalIDA blendIDA onlyIDA totalIndiaIndonesiaIran, Islamic Rep.IraqIrelandIsraelItalyJamaicaJapanJordanKazakhstanKenyaKiribatiKorea, Rep.KosovoKuwaitKyrgyz RepublicLao PDRLate-demographic dividendLatin America & Caribbean Latin America & Caribbean (excluding high income)Latin America & the Caribbean (IDA & IBRD countries)LatviaLeast developed countries: UN classificationLebanonLesothoLiberiaLibyaLithuaniaLow & middle incomeLow incomeLower middle incomeLuxembourgMacao SAR, ChinaMacedonia, FYRMadagascarMalawiMalaysiaMaldivesMaliMaltaMarshall IslandsMauritaniaMauritiusMexicoMicronesia, Fed. Sts.Middle East & North AfricaMiddle East & North Africa (excluding high income)Middle East & North Africa (IDA & IBRD countries)Middle incomeMoldovaMongoliaMontenegroMoroccoMozambiqueMyanmarNamibiaNauruNepalNetherlandsNew ZealandNicaraguaNigerNigeriaNorth AmericaNorwayOECD membersOmanOther small statesPacific island small statesPakistanPalauPanamaPapua New GuineaParaguayPeruPhilippinesPolandPortugalPost-demographic dividendPre-demographic dividendPuerto RicoQatarRomaniaRussian FederationRwandaSamoaSao Tome and PrincipeSaudi ArabiaSenegalSerbiaSeychellesSierra LeoneSingaporeSint Maarten (Dutch part)Slovak RepublicSloveniaSmall statesSolomon IslandsSouth AfricaSouth AsiaSouth Asia (IDA & IBRD)South SudanSpainSri LankaSt. Kitts and NevisSt. LuciaSt. Vincent and the GrenadinesSub-Saharan Africa Sub-Saharan Africa (excluding high income)Sub-Saharan Africa (IDA & IBRD countries)SudanSurinameSwazilandSwedenSwitzerlandTajikistanTanzaniaThailandTimor-LesteTogoTongaTrinidad and TobagoTunisiaTurkeyTurkmenistanTuvaluUgandaUkraineUnited Arab EmiratesUnited KingdomUnited StatesUpper middle incomeUruguayUzbekistanVanuatuVenezuela, RBVietnamWest Bank and GazaWorldYemen, Rep.ZambiaZimbabwe

línea de tiempo (timeline):

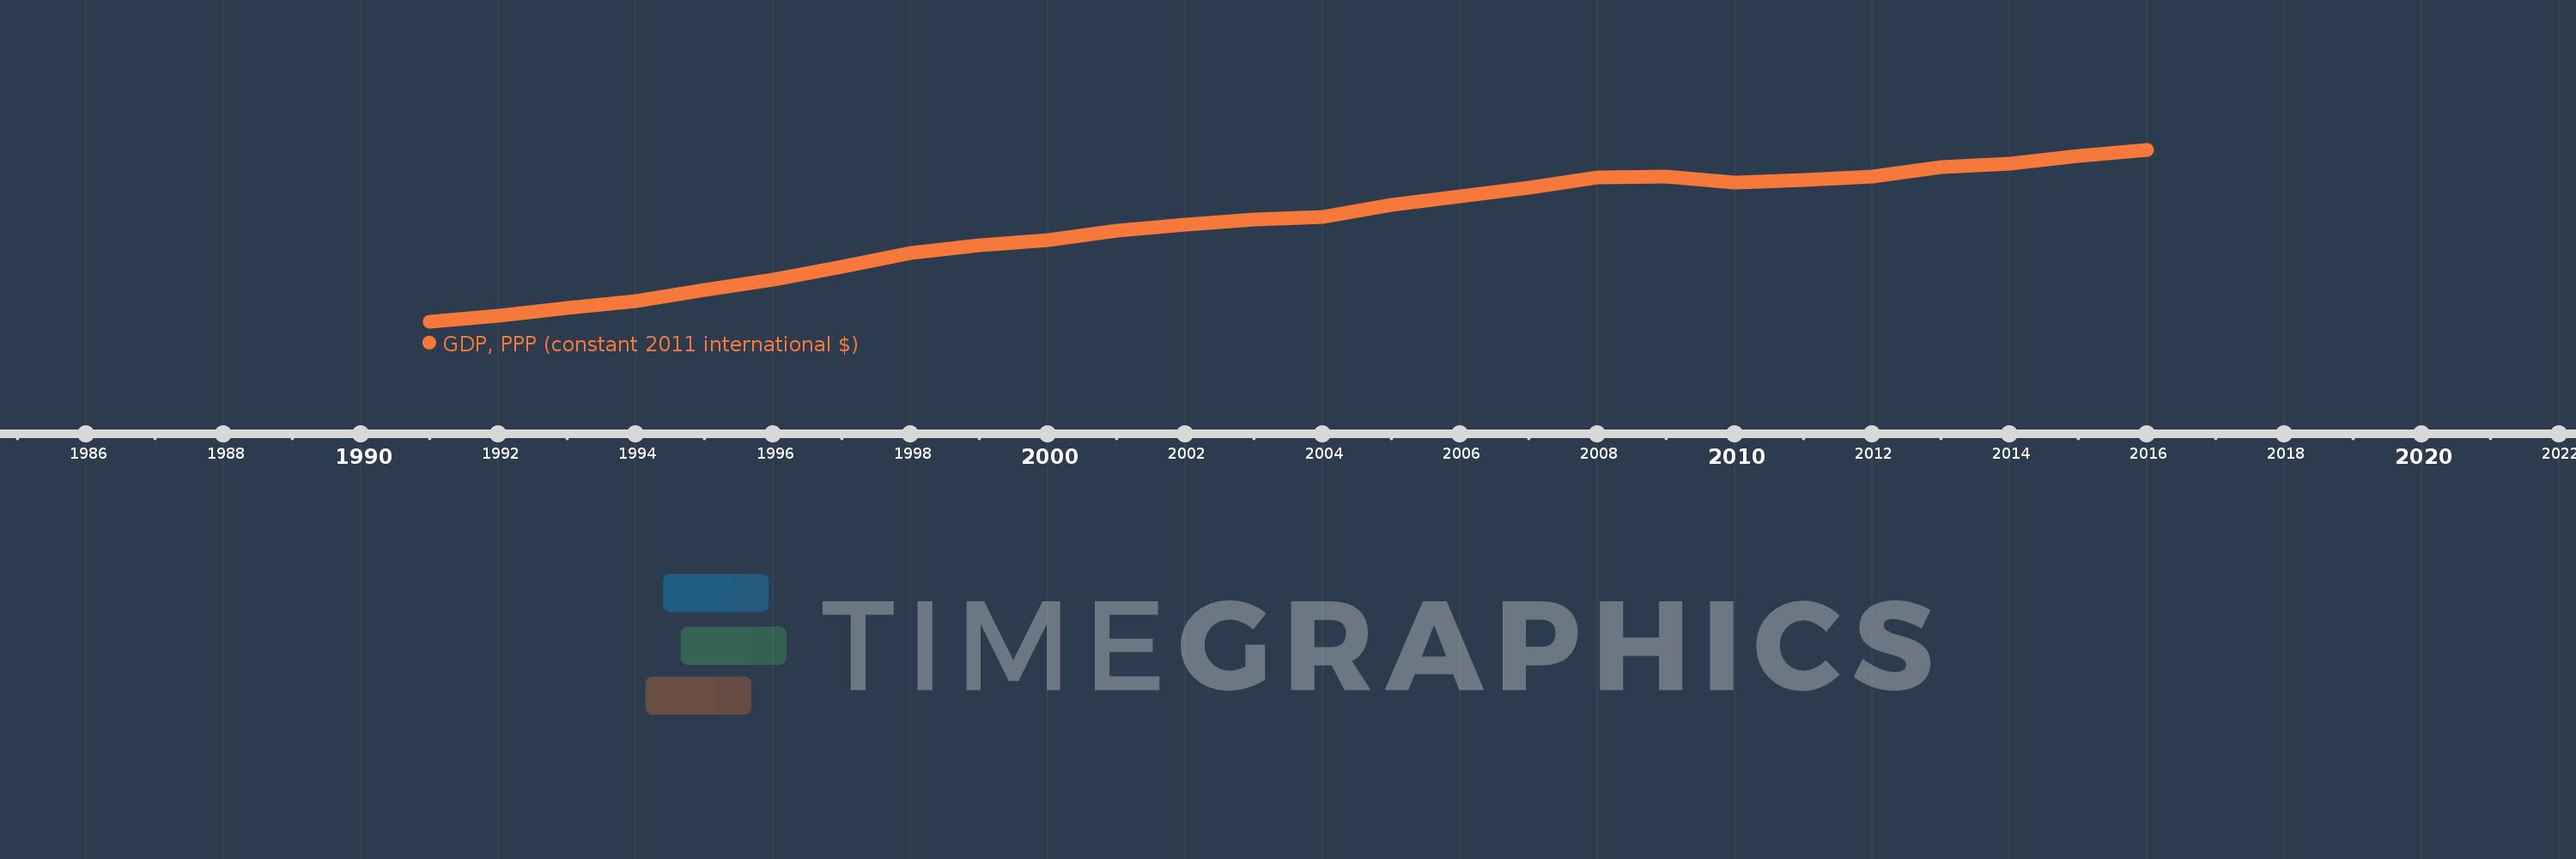
En esta escala de tiempo se presenta un gráfico de 1991 y 2016 de Norway. Los datos de 1990 están ausentes. El número de observaciones reales por fecha: 26.

Fuente (nombre):

Indicadores del desarrollo mundial

Fuente (organización):

World Bank, International Comparison Program database.

Categorías:

Economy & Growth

Se ha actualizado:

23 abr 2017 año

Los indicadores de los cambios de valor en los últimos años

En promedio:
266.204 bn
Mínimo:
181.661 bn
1 ene 1991 año
Máximo:
330.356 bn
1 ene 2016 año
A la fecha de observación
Valor
Cambio absoluto
El cambio con respecto al valor anterior
1 ene 1991 año
181.661 bn
+181.661 bn
0.0%
1 ene 1992 año
187.264 bn
+5.604 bn
3.08%
1 ene 1993 año
193.958 bn
+6.694 bn
3.57%
1 ene 1994 año
199.477 bn
+5.519 bn
2.85%
1 ene 1995 año
209.561 bn
+10.084 bn
5.06%
1 ene 1996 año
218.266 bn
+8.705 bn
4.15%
1 ene 1997 año
229.241 bn
+10.974 bn
5.03%
1 ene 1998 año
241.355 bn
+12.115 bn
5.28%
1 ene 1999 año
247.689 bn
+6.334 bn
2.62%
1 ene 2000 año
252.676 bn
+4.987 bn
2.01%
1 ene 2001 año
260.775 bn
+8.099 bn
3.21%
1 ene 2002 año
266.213 bn
+5.438 bn
2.09%
1 ene 2003 año
270.041 bn
+3.827 bn
1.44%
1 ene 2004 año
272.524 bn
+2.484 bn
0.92%
1 ene 2005 año
283.314 bn
+10.789 bn
3.96%
1 ene 2006 año
290.75 bn
+7.436 bn
2.62%
1 ene 2007 año
297.714 bn
+6.964 bn
2.4%
1 ene 2008 año
306.436 bn
+8.722 bn
2.93%
1 ene 2009 año
307.614 bn
+1.178 bn
0.38%
1 ene 2010 año
302.623 bn
-4.991 bn
-1.62%
1 ene 2011 año
304.444 bn
+1.821 bn
0.6%
1 ene 2012 año
307.393 bn
+2.949 bn
0.97%
1 ene 2013 año
315.843 bn
+8.45 bn
2.75%
1 ene 2014 año
318.997 bn
+3.154 bn
1.0%
1 ene 2015 año
325.118 bn
+6.121 bn
1.92%
1 ene 2016 año
330.356 bn
+5.238 bn
1.61%

Ranking de los países por los datos estadísticos actuales