29
/es/
es
AIzaSyAYiBZKx7MnpbEhh9jyipgxe19OcubqV5w
April 1, 2024
76919
Bahrain
BHR
true
2
1
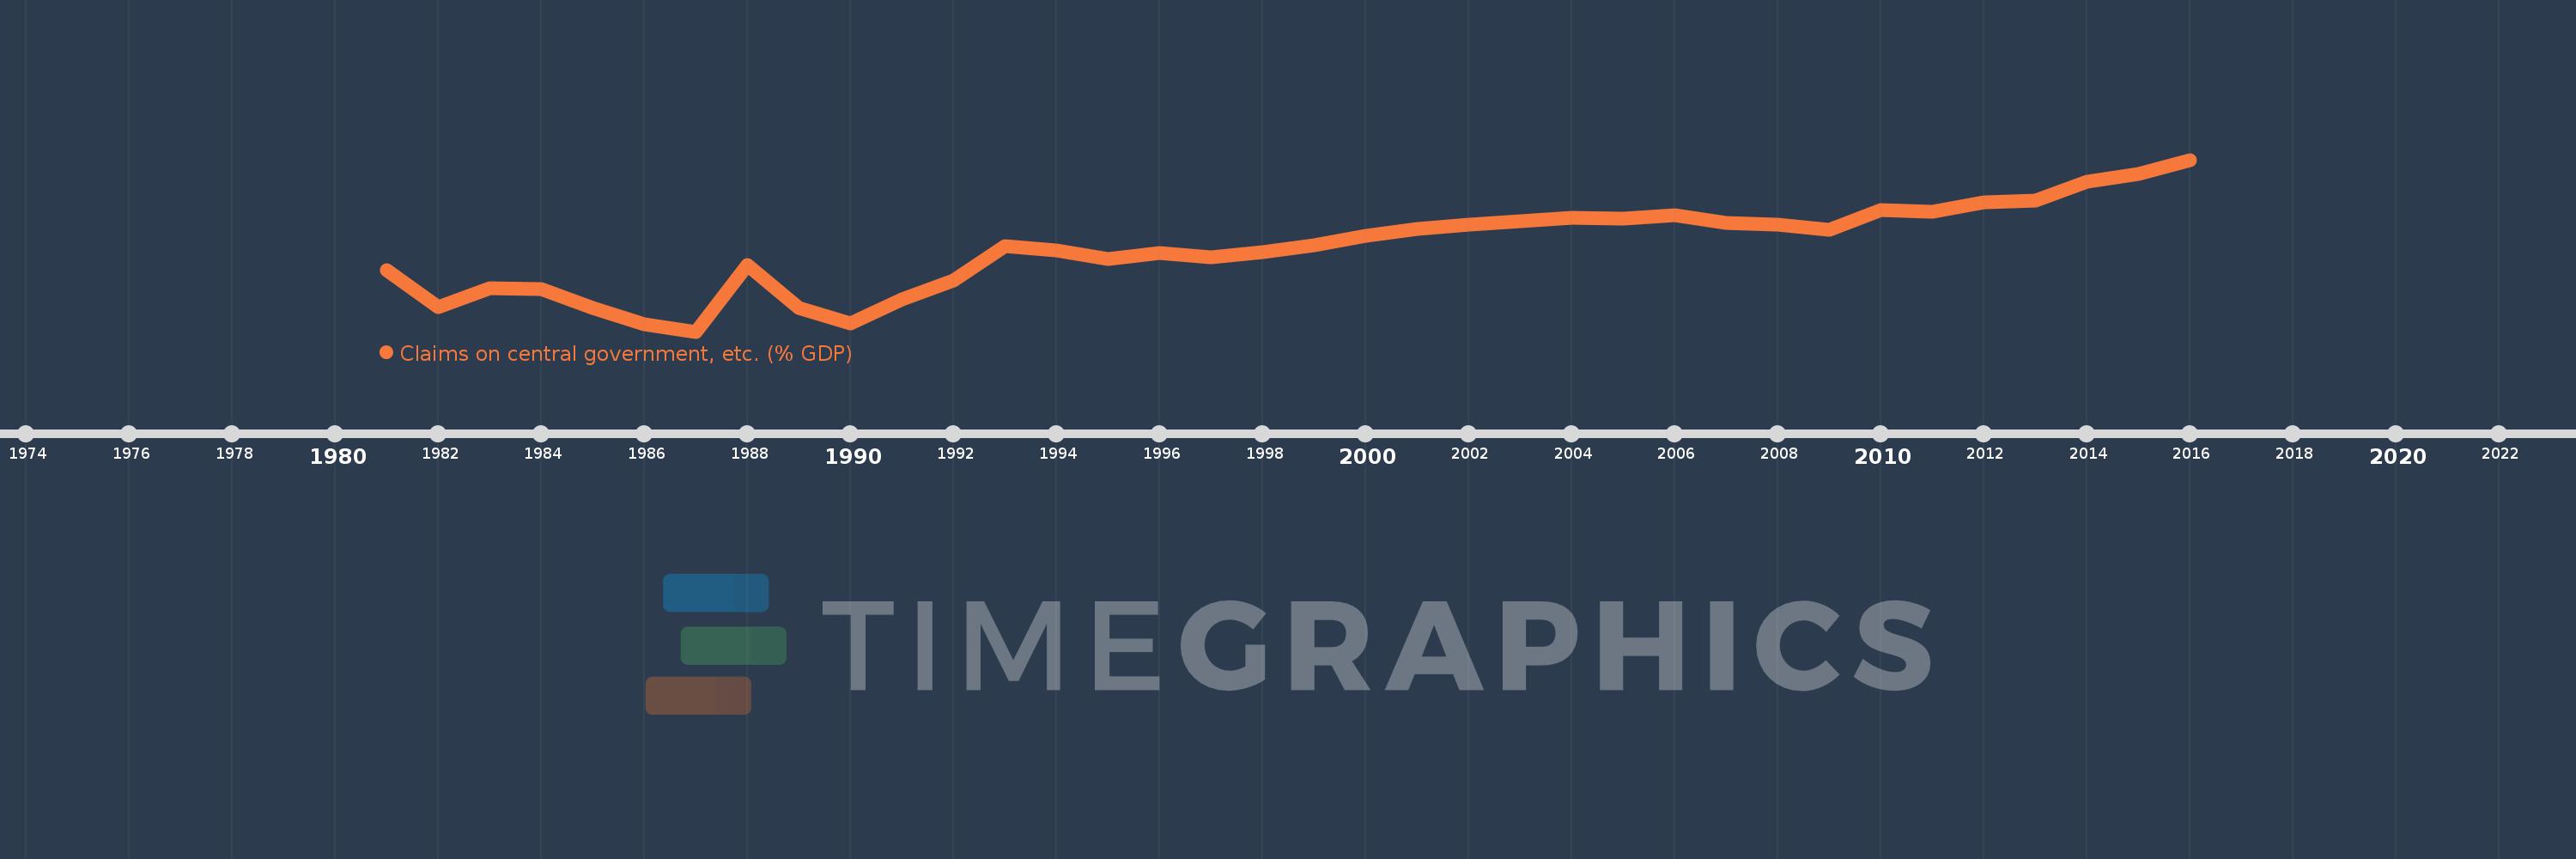
Claims on central government, etc. (% GDP)
2016,2015,2014,2013,2012,2011,2010,2009,2008,2007,2006,2005,2004,2003,2002,2001,2000,1999,1998,1997,1996,1995,1994,1993,1992,1991,1990,1989,1988,1987,1986,1985,1984,1983,1982,1981
Estas estadísticas en otros países:
AfghanistanAlbaniaAlgeriaAngolaAntigua and BarbudaArab WorldArgentinaArmeniaArubaAustraliaAustriaAzerbaijanBahamas, TheBahrainBangladeshBarbadosBelarusBelgiumBelizeBeninBhutanBoliviaBosnia and HerzegovinaBotswanaBrazilBrunei DarussalamBulgariaBurkina FasoBurundiCabo VerdeCambodiaCameroonCanadaCaribbean small statesCentral African RepublicCentral Europe and the BalticsChadChileChinaColombiaComorosCongo, Dem. Rep.Congo, Rep.Costa RicaCote d'IvoireCroatiaCyprusCzech RepublicDenmarkDjiboutiDominicaDominican RepublicEarly-demographic dividendEast Asia & PacificEast Asia & Pacific (excluding high income)East Asia & Pacific (IDA & IBRD countries)EcuadorEgypt, Arab Rep.El SalvadorEquatorial GuineaEritreaEstoniaEthiopiaEuro areaEurope & Central AsiaEurope & Central Asia (excluding high income)Europe & Central Asia (IDA & IBRD countries)European UnionFijiFinlandFragile and conflict affected situationsFranceGabonGambia, TheGeorgiaGermanyGhanaGreeceGrenadaGuatemalaGuineaGuinea-BissauGuyanaHaitiHeavily indebted poor countries (HIPC)High incomeHondurasHong Kong SAR, ChinaHungaryIBRD onlyIcelandIDA & IBRD totalIDA blendIDA onlyIDA totalIndiaIndonesiaIran, Islamic Rep.IraqIrelandIsraelItalyJamaicaJapanJordanKazakhstanKenyaKorea, Rep.KosovoKuwaitKyrgyz RepublicLao PDRLate-demographic dividendLatin America & Caribbean Latin America & Caribbean (excluding high income)Latin America & the Caribbean (IDA & IBRD countries)LatviaLeast developed countries: UN classificationLebanonLesothoLiberiaLibyaLithuaniaLow & middle incomeLow incomeLower middle incomeLuxembourgMacao SAR, ChinaMacedonia, FYRMadagascarMalawiMalaysiaMaldivesMaliMaltaMauritaniaMauritiusMexicoMicronesia, Fed. Sts.Middle East & North AfricaMiddle East & North Africa (excluding high income)Middle East & North Africa (IDA & IBRD countries)Middle incomeMoldovaMongoliaMontenegroMoroccoMozambiqueMyanmarNamibiaNepalNetherlandsNew ZealandNicaraguaNigerNigeriaNorth AmericaNorwayOECD membersOmanOther small statesPacific island small statesPakistanPanamaPapua New GuineaParaguayPeruPhilippinesPolandPortugalPost-demographic dividendPre-demographic dividendQatarRomaniaRussian FederationRwandaSamoaSao Tome and PrincipeSaudi ArabiaSenegalSerbiaSeychellesSierra LeoneSingaporeSlovak RepublicSloveniaSmall statesSolomon IslandsSouth AfricaSouth AsiaSouth Asia (IDA & IBRD)South SudanSpainSri LankaSt. Kitts and NevisSt. LuciaSt. Vincent and the GrenadinesSub-Saharan Africa Sub-Saharan Africa (excluding high income)Sub-Saharan Africa (IDA & IBRD countries)SudanSurinameSwazilandSwedenSwitzerlandSyrian Arab RepublicTajikistanTanzaniaThailandTimor-LesteTogoTongaTrinidad and TobagoTunisiaTurkeyUgandaUkraineUnited Arab EmiratesUnited KingdomUnited StatesUpper middle incomeUruguayVanuatuVenezuela, RBVietnamWest Bank and GazaWorldYemen, Rep.ZambiaZimbabwe línea de tiempo (timeline):
En esta escala de tiempo se presenta un gráfico de 1981 y 2016 de Bahrain. Los datos de 1980 están ausentes. El número de observaciones reales por fecha: 36.
Fuente (nombre):
Indicadores del desarrollo mundial
Fuente (organización):
International Monetary Fund, International Financial Statistics and data files, and World Bank and OECD GDP estimates.
Categorías:
Financial Sector
Se ha actualizado:
23 abr 2017 año
Los indicadores de los cambios de valor en los últimos años
Mínimo:
-41.816
1 ene 1987 año
Máximo:
17.177
1 ene 2016 año
A la fecha de observación
Valor
Cambio absoluto
El cambio con respecto al valor anterior
1 ene 1981 año
-20.822
-20.822
0.0%
1 ene 1982 año
-33.388
-12.566
60.35%
1 ene 1983 año
-26.816
+6.571
-19.68%
1 ene 1984 año
-27.304
-0.488
1.82%
1 ene 1985 año
-33.577
-6.272
22.97%
1 ene 1986 año
-39.347
-5.77
17.19%
1 ene 1987 año
-41.816
-2.469
6.27%
1 ene 1988 año
-18.819
+22.997
-55.0%
1 ene 1989 año
-33.703
-14.884
79.09%
1 ene 1990 año
-39.027
-5.324
15.8%
1 ene 1991 año
-30.882
+8.145
-20.87%
1 ene 1992 año
-24.191
+6.691
-21.67%
1 ene 1993 año
-12.463
+11.728
-48.48%
1 ene 1994 año
-14.087
-1.624
13.03%
1 ene 1995 año
-17.034
-2.947
20.92%
1 ene 1996 año
-14.729
+2.305
-13.53%
1 ene 1997 año
-16.325
-1.595
10.83%
1 ene 1998 año
-14.64
+1.685
-10.32%
1 ene 1999 año
-12.203
+2.437
-16.65%
1 ene 2000 año
-8.805
+3.398
-27.85%
1 ene 2001 año
-6.654
+2.151
-24.43%
1 ene 2002 año
-5.221
+1.433
-21.53%
1 ene 2003 año
-3.93
+1.291
-24.72%
1 ene 2004 año
-2.757
+1.174
-29.86%
1 ene 2005 año
-3.099
-0.342
12.42%
1 ene 2006 año
-1.851
+1.248
-40.28%
1 ene 2007 año
-4.582
-2.731
147.55%
1 ene 2008 año
-5.12
-0.538
11.75%
1 ene 2009 año
-6.91
-1.79
34.95%
1 ene 2010 año
-0.221
+6.689
-96.8%
1 ene 2011 año
-0.577
-0.356
160.9%
1 ene 2012 año
2.663
+3.24
-561.21%
1 ene 2013 año
3.02
+0.357
13.42%
1 ene 2014 año
9.563
+6.543
216.62%
1 ene 2015 año
12.307
+2.744
28.69%
1 ene 2016 año
17.177
+4.87
39.57%
Ranking de los países por los datos estadísticos actuales


Comentarios: