29
/es/
es
AIzaSyAYiBZKx7MnpbEhh9jyipgxe19OcubqV5w
April 1, 2024
215069
Oman
OMN
true
2
1
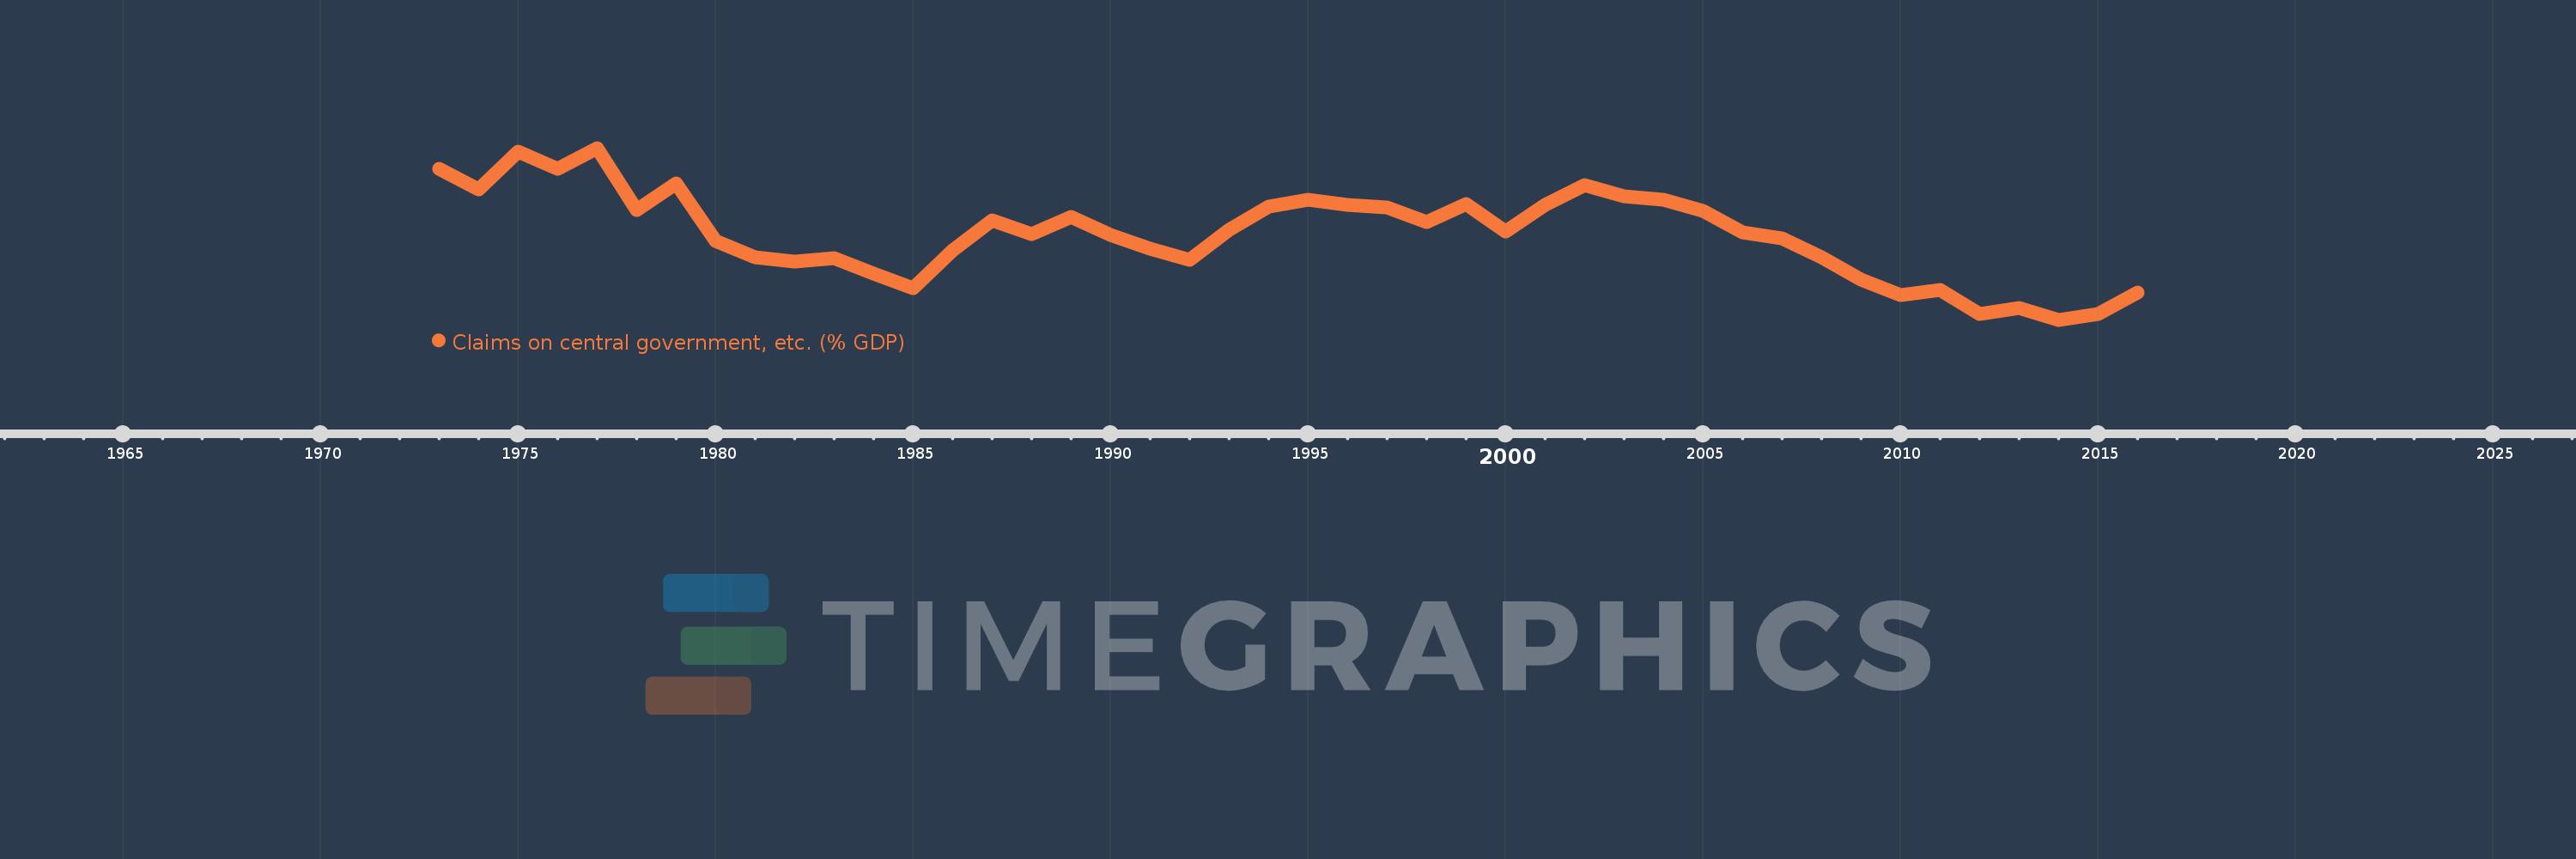
Claims on central government, etc. (% GDP)
2016,2015,2014,2013,2012,2011,2010,2009,2008,2007,2006,2005,2004,2003,2002,2001,2000,1999,1998,1997,1996,1995,1994,1993,1992,1991,1990,1989,1988,1987,1986,1985,1984,1983,1982,1981,1980,1979,1978,1977,1976,1975,1974,1973
Estas estadísticas en otros países:
AfghanistanAlbaniaAlgeriaAngolaAntigua and BarbudaArab WorldArgentinaArmeniaArubaAustraliaAustriaAzerbaijanBahamas, TheBahrainBangladeshBarbadosBelarusBelgiumBelizeBeninBhutanBoliviaBosnia and HerzegovinaBotswanaBrazilBrunei DarussalamBulgariaBurkina FasoBurundiCabo VerdeCambodiaCameroonCanadaCaribbean small statesCentral African RepublicCentral Europe and the BalticsChadChileChinaColombiaComorosCongo, Dem. Rep.Congo, Rep.Costa RicaCote d'IvoireCroatiaCyprusCzech RepublicDenmarkDjiboutiDominicaDominican RepublicEarly-demographic dividendEast Asia & PacificEast Asia & Pacific (excluding high income)East Asia & Pacific (IDA & IBRD countries)EcuadorEgypt, Arab Rep.El SalvadorEquatorial GuineaEritreaEstoniaEthiopiaEuro areaEurope & Central AsiaEurope & Central Asia (excluding high income)Europe & Central Asia (IDA & IBRD countries)European UnionFijiFinlandFragile and conflict affected situationsFranceGabonGambia, TheGeorgiaGermanyGhanaGreeceGrenadaGuatemalaGuineaGuinea-BissauGuyanaHaitiHeavily indebted poor countries (HIPC)High incomeHondurasHong Kong SAR, ChinaHungaryIBRD onlyIcelandIDA & IBRD totalIDA blendIDA onlyIDA totalIndiaIndonesiaIran, Islamic Rep.IraqIrelandIsraelItalyJamaicaJapanJordanKazakhstanKenyaKorea, Rep.KosovoKuwaitKyrgyz RepublicLao PDRLate-demographic dividendLatin America & Caribbean Latin America & Caribbean (excluding high income)Latin America & the Caribbean (IDA & IBRD countries)LatviaLeast developed countries: UN classificationLebanonLesothoLiberiaLibyaLithuaniaLow & middle incomeLow incomeLower middle incomeLuxembourgMacao SAR, ChinaMacedonia, FYRMadagascarMalawiMalaysiaMaldivesMaliMaltaMauritaniaMauritiusMexicoMicronesia, Fed. Sts.Middle East & North AfricaMiddle East & North Africa (excluding high income)Middle East & North Africa (IDA & IBRD countries)Middle incomeMoldovaMongoliaMontenegroMoroccoMozambiqueMyanmarNamibiaNepalNetherlandsNew ZealandNicaraguaNigerNigeriaNorth AmericaNorwayOECD membersOmanOther small statesPacific island small statesPakistanPanamaPapua New GuineaParaguayPeruPhilippinesPolandPortugalPost-demographic dividendPre-demographic dividendQatarRomaniaRussian FederationRwandaSamoaSao Tome and PrincipeSaudi ArabiaSenegalSerbiaSeychellesSierra LeoneSingaporeSlovak RepublicSloveniaSmall statesSolomon IslandsSouth AfricaSouth AsiaSouth Asia (IDA & IBRD)South SudanSpainSri LankaSt. Kitts and NevisSt. LuciaSt. Vincent and the GrenadinesSub-Saharan Africa Sub-Saharan Africa (excluding high income)Sub-Saharan Africa (IDA & IBRD countries)SudanSurinameSwazilandSwedenSwitzerlandSyrian Arab RepublicTajikistanTanzaniaThailandTimor-LesteTogoTongaTrinidad and TobagoTunisiaTurkeyUgandaUkraineUnited Arab EmiratesUnited KingdomUnited StatesUpper middle incomeUruguayVanuatuVenezuela, RBVietnamWest Bank and GazaWorldYemen, Rep.ZambiaZimbabwe línea de tiempo (timeline):
En esta escala de tiempo se presenta un gráfico de 1973 y 2016 de Oman. Los datos de 1972 están ausentes. El número de observaciones reales por fecha: 44.
Fuente (nombre):
Indicadores del desarrollo mundial
Fuente (organización):
International Monetary Fund, International Financial Statistics and data files, and World Bank and OECD GDP estimates.
Categorías:
Financial Sector
Se ha actualizado:
23 abr 2017 año
Los indicadores de los cambios de valor en los últimos años
Mínimo:
-15.694
1 ene 2014 año
Máximo:
7.746
1 ene 1977 año
A la fecha de observación
Valor
Cambio absoluto
El cambio con respecto al valor anterior
1 ene 1973 año
4.852
+4.852
0.0%
1 ene 1974 año
2.049
-2.803
-57.77%
1 ene 1975 año
7.186
+5.137
250.7%
1 ene 1976 año
4.923
-2.263
-31.5%
1 ene 1977 año
7.746
+2.824
57.37%
1 ene 1978 año
-0.76
-8.507
-109.82%
1 ene 1979 año
2.893
+3.653
-480.4%
1 ene 1980 año
-4.955
-7.848
-271.29%
1 ene 1981 año
-7.117
-2.162
43.64%
1 ene 1982 año
-7.775
-0.658
9.24%
1 ene 1983 año
-7.266
+0.509
-6.55%
1 ene 1984 año
-9.445
-2.179
30.0%
1 ene 1985 año
-11.394
-1.949
20.63%
1 ene 1986 año
-6.267
+5.127
-45.0%
1 ene 1987 año
-2.144
+4.123
-65.79%
1 ene 1988 año
-4.006
-1.862
86.85%
1 ene 1989 año
-1.673
+2.333
-58.23%
1 ene 1990 año
-4.135
-2.461
147.1%
1 ene 1991 año
-5.985
-1.85
44.74%
1 ene 1992 año
-7.498
-1.513
25.28%
1 ene 1993 año
-3.424
+4.073
-54.33%
1 ene 1994 año
-0.26
+3.165
-92.42%
1 ene 1995 año
0.628
+0.887
-341.89%
1 ene 1996 año
-0.008
-0.636
-101.22%
1 ene 1997 año
-0.333
-0.325
4.25 mil%
1 ene 1998 año
-2.402
-2.069
621.33%
1 ene 1999 año
0.15
+2.552
-106.23%
1 ene 2000 año
-3.641
-3.79
-2.53 mil%
1 ene 2001 año
-0.055
+3.586
-98.5%
1 ene 2002 año
2.695
+2.75
-5.04 mil%
1 ene 2003 año
1.167
-1.528
-56.7%
1 ene 2004 año
0.643
-0.524
-44.88%
1 ene 2005 año
-0.881
-1.524
-236.98%
1 ene 2006 año
-3.824
-2.943
333.97%
1 ene 2007 año
-4.557
-0.733
19.17%
1 ene 2008 año
-7.166
-2.609
57.26%
1 ene 2009 año
-10.272
-3.106
43.34%
1 ene 2010 año
-12.346
-2.074
20.19%
1 ene 2011 año
-11.612
+0.734
-5.94%
1 ene 2012 año
-14.852
-3.24
27.91%
1 ene 2013 año
-14.061
+0.792
-5.33%
1 ene 2014 año
-15.694
-1.633
11.62%
1 ene 2015 año
-14.921
+0.774
-4.93%
1 ene 2016 año
-12.006
+2.915
-19.53%
Ranking de los países por los datos estadísticos actuales


Comentarios: