29
/es/
es
AIzaSyAYiBZKx7MnpbEhh9jyipgxe19OcubqV5w
April 1, 2024
125908
El Salvador
SLV
true
2
1
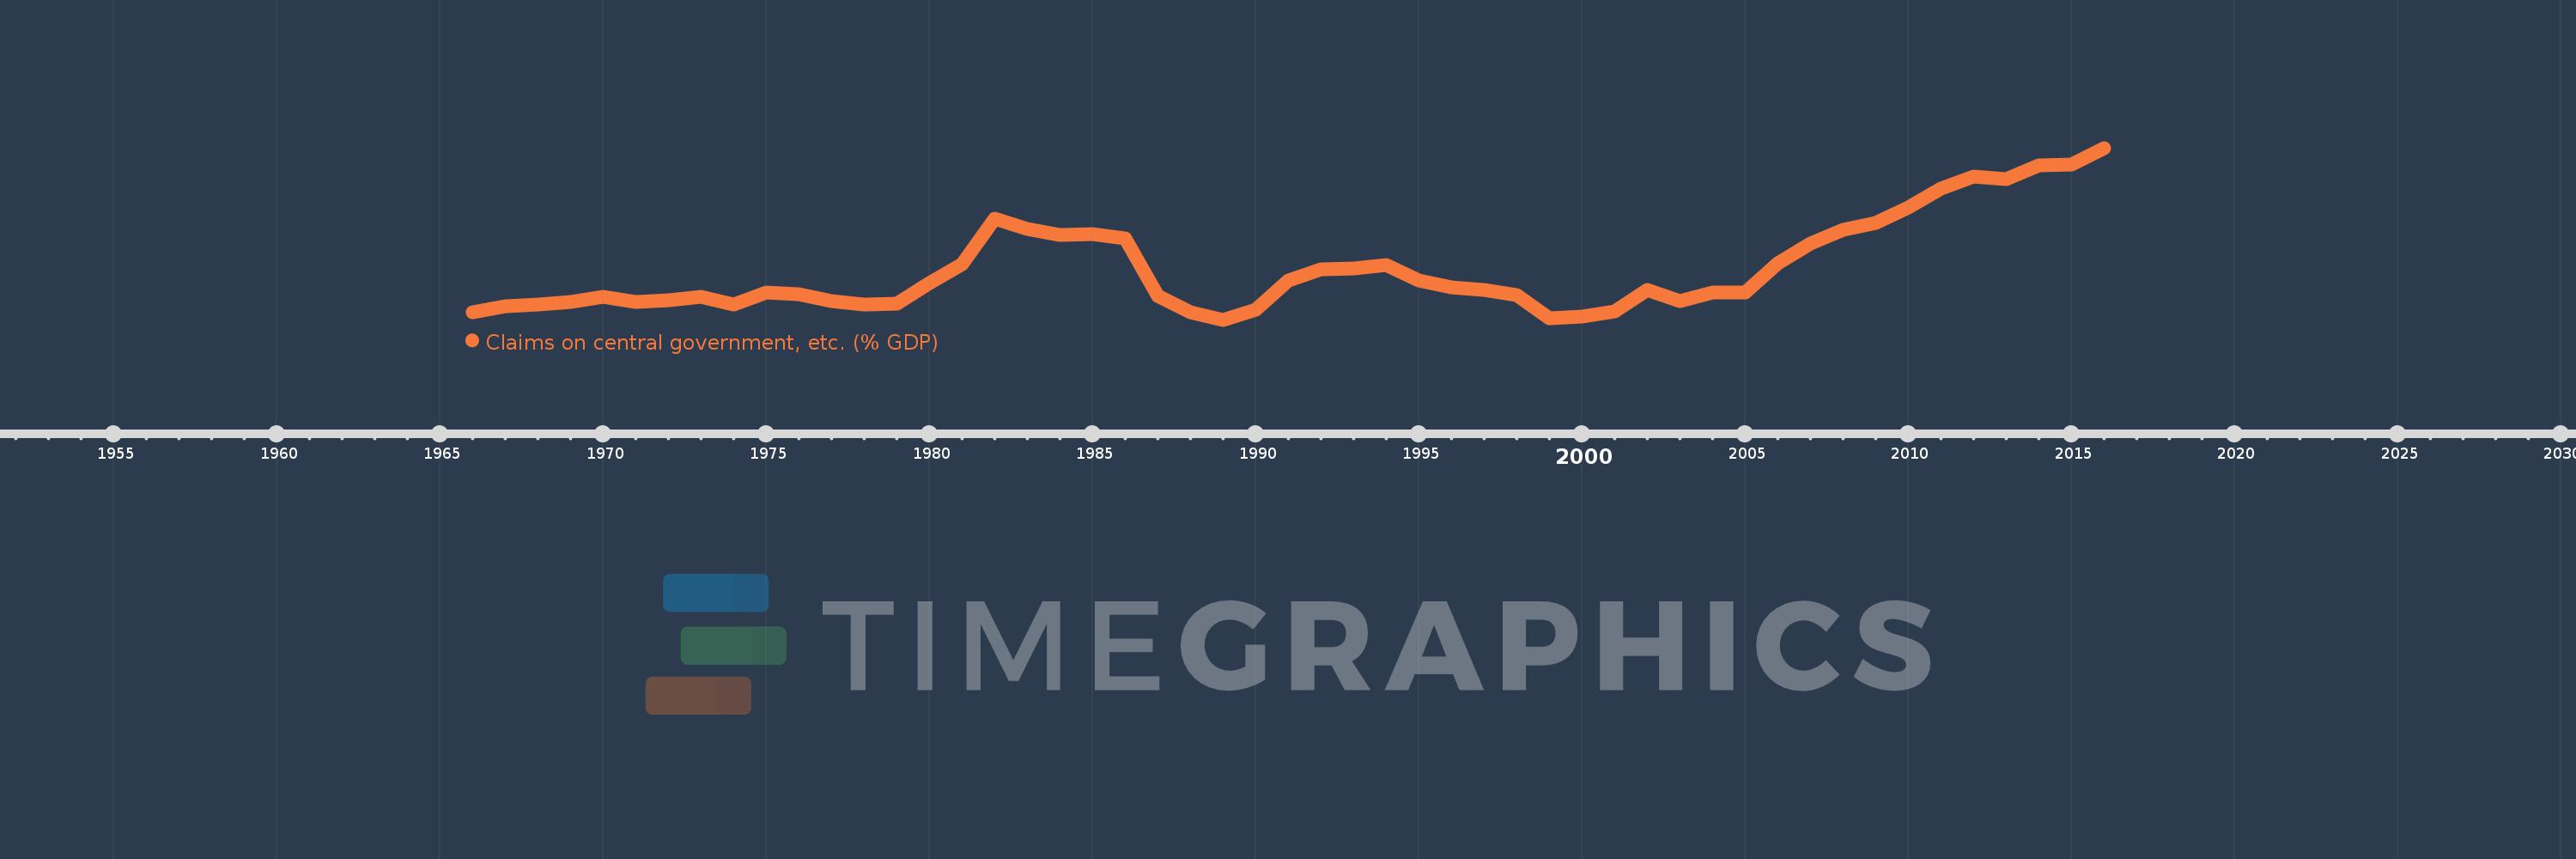
Claims on central government, etc. (% GDP)
2016,2015,2014,2013,2012,2011,2010,2009,2008,2007,2006,2005,2004,2003,2002,2001,2000,1999,1998,1997,1996,1995,1994,1993,1992,1991,1990,1989,1988,1987,1986,1985,1984,1983,1982,1981,1980,1979,1978,1977,1976,1975,1974,1973,1972,1971,1970,1969,1968,1967,1966
Estas estadísticas en otros países:
AfghanistanAlbaniaAlgeriaAngolaAntigua and BarbudaArab WorldArgentinaArmeniaArubaAustraliaAustriaAzerbaijanBahamas, TheBahrainBangladeshBarbadosBelarusBelgiumBelizeBeninBhutanBoliviaBosnia and HerzegovinaBotswanaBrazilBrunei DarussalamBulgariaBurkina FasoBurundiCabo VerdeCambodiaCameroonCanadaCaribbean small statesCentral African RepublicCentral Europe and the BalticsChadChileChinaColombiaComorosCongo, Dem. Rep.Congo, Rep.Costa RicaCote d'IvoireCroatiaCyprusCzech RepublicDenmarkDjiboutiDominicaDominican RepublicEarly-demographic dividendEast Asia & PacificEast Asia & Pacific (excluding high income)East Asia & Pacific (IDA & IBRD countries)EcuadorEgypt, Arab Rep.El SalvadorEquatorial GuineaEritreaEstoniaEthiopiaEuro areaEurope & Central AsiaEurope & Central Asia (excluding high income)Europe & Central Asia (IDA & IBRD countries)European UnionFijiFinlandFragile and conflict affected situationsFranceGabonGambia, TheGeorgiaGermanyGhanaGreeceGrenadaGuatemalaGuineaGuinea-BissauGuyanaHaitiHeavily indebted poor countries (HIPC)High incomeHondurasHong Kong SAR, ChinaHungaryIBRD onlyIcelandIDA & IBRD totalIDA blendIDA onlyIDA totalIndiaIndonesiaIran, Islamic Rep.IraqIrelandIsraelItalyJamaicaJapanJordanKazakhstanKenyaKorea, Rep.KosovoKuwaitKyrgyz RepublicLao PDRLate-demographic dividendLatin America & Caribbean Latin America & Caribbean (excluding high income)Latin America & the Caribbean (IDA & IBRD countries)LatviaLeast developed countries: UN classificationLebanonLesothoLiberiaLibyaLithuaniaLow & middle incomeLow incomeLower middle incomeLuxembourgMacao SAR, ChinaMacedonia, FYRMadagascarMalawiMalaysiaMaldivesMaliMaltaMauritaniaMauritiusMexicoMicronesia, Fed. Sts.Middle East & North AfricaMiddle East & North Africa (excluding high income)Middle East & North Africa (IDA & IBRD countries)Middle incomeMoldovaMongoliaMontenegroMoroccoMozambiqueMyanmarNamibiaNepalNetherlandsNew ZealandNicaraguaNigerNigeriaNorth AmericaNorwayOECD membersOmanOther small statesPacific island small statesPakistanPanamaPapua New GuineaParaguayPeruPhilippinesPolandPortugalPost-demographic dividendPre-demographic dividendQatarRomaniaRussian FederationRwandaSamoaSao Tome and PrincipeSaudi ArabiaSenegalSerbiaSeychellesSierra LeoneSingaporeSlovak RepublicSloveniaSmall statesSolomon IslandsSouth AfricaSouth AsiaSouth Asia (IDA & IBRD)South SudanSpainSri LankaSt. Kitts and NevisSt. LuciaSt. Vincent and the GrenadinesSub-Saharan Africa Sub-Saharan Africa (excluding high income)Sub-Saharan Africa (IDA & IBRD countries)SudanSurinameSwazilandSwedenSwitzerlandSyrian Arab RepublicTajikistanTanzaniaThailandTimor-LesteTogoTongaTrinidad and TobagoTunisiaTurkeyUgandaUkraineUnited Arab EmiratesUnited KingdomUnited StatesUpper middle incomeUruguayVanuatuVenezuela, RBVietnamWest Bank and GazaWorldYemen, Rep.ZambiaZimbabwe línea de tiempo (timeline):
En esta escala de tiempo se presenta un gráfico de 1966 y 2016 de El Salvador. Los datos de 1965 están ausentes. El número de observaciones reales por fecha: 51.
Fuente (nombre):
Indicadores del desarrollo mundial
Fuente (organización):
International Monetary Fund, International Financial Statistics and data files, and World Bank and OECD GDP estimates.
Categorías:
Financial Sector
Se ha actualizado:
23 abr 2017 año
Los indicadores de los cambios de valor en los últimos años
Mínimo:
-0.584
1 ene 1989 año
Máximo:
31.352
1 ene 2016 año
A la fecha de observación
Valor
Cambio absoluto
El cambio con respecto al valor anterior
1 ene 1966 año
0.819
+0.819
0.0%
1 ene 1967 año
1.922
+1.102
134.55%
1 ene 1968 año
2.216
+0.294
15.3%
1 ene 1969 año
2.662
+0.446
20.15%
1 ene 1970 año
3.646
+0.983
36.93%
1 ene 1971 año
2.769
-0.876
-24.04%
1 ene 1972 año
3.083
+0.314
11.35%
1 ene 1973 año
3.639
+0.556
18.02%
1 ene 1974 año
2.221
-1.418
-38.97%
1 ene 1975 año
4.468
+2.247
101.17%
1 ene 1976 año
4.101
-0.367
-8.21%
1 ene 1977 año
2.937
-1.164
-28.39%
1 ene 1978 año
2.235
-0.701
-23.87%
1 ene 1979 año
2.458
+0.222
9.94%
1 ene 1980 año
6.203
+3.745
152.38%
1 ene 1981 año
9.687
+3.484
56.17%
1 ene 1982 año
18.27
+8.583
88.61%
1 ene 1983 año
16.304
-1.966
-10.76%
1 ene 1984 año
15.109
-1.195
-7.33%
1 ene 1985 año
15.298
+0.189
1.25%
1 ene 1986 año
14.536
-0.761
-4.98%
1 ene 1987 año
3.876
-10.661
-73.34%
1 ene 1988 año
0.828
-3.048
-78.64%
1 ene 1989 año
-0.584
-1.411
-170.53%
1 ene 1990 año
1.269
+1.853
-317.44%
1 ene 1991 año
6.71
+5.441
428.61%
1 ene 1992 año
8.766
+2.056
30.64%
1 ene 1993 año
9.008
+0.242
2.77%
1 ene 1994 año
9.631
+0.623
6.91%
1 ene 1995 año
6.696
-2.935
-30.47%
1 ene 1996 año
5.357
-1.339
-19.99%
1 ene 1997 año
4.992
-0.365
-6.81%
1 ene 1998 año
3.964
-1.028
-20.6%
1 ene 1999 año
-0.339
-4.303
-108.55%
1 ene 2000 año
-0.026
+0.312
-92.22%
1 ene 2001 año
1.005
+1.032
-3.91 mil%
1 ene 2002 año
4.909
+3.903
388.21%
1 ene 2003 año
2.87
-2.039
-41.53%
1 ene 2004 año
4.439
+1.569
54.68%
1 ene 2005 año
4.499
+0.059
1.33%
1 ene 2006 año
9.902
+5.403
120.1%
1 ene 2007 año
13.633
+3.732
37.69%
1 ene 2008 año
16.181
+2.548
18.69%
1 ene 2009 año
17.428
+1.247
7.71%
1 ene 2010 año
20.22
+2.791
16.02%
1 ene 2011 año
23.763
+3.543
17.52%
1 ene 2012 año
25.963
+2.2
9.26%
1 ene 2013 año
25.506
-0.456
-1.76%
1 ene 2014 año
28.179
+2.673
10.48%
1 ene 2015 año
28.323
+0.144
0.51%
1 ene 2016 año
31.352
+3.029
10.69%
Ranking de los países por los datos estadísticos actuales


Comentarios: