29
/es/
es
AIzaSyAYiBZKx7MnpbEhh9jyipgxe19OcubqV5w
April 1, 2024
68666
Antigua and Barbuda
ATG
true
2
1
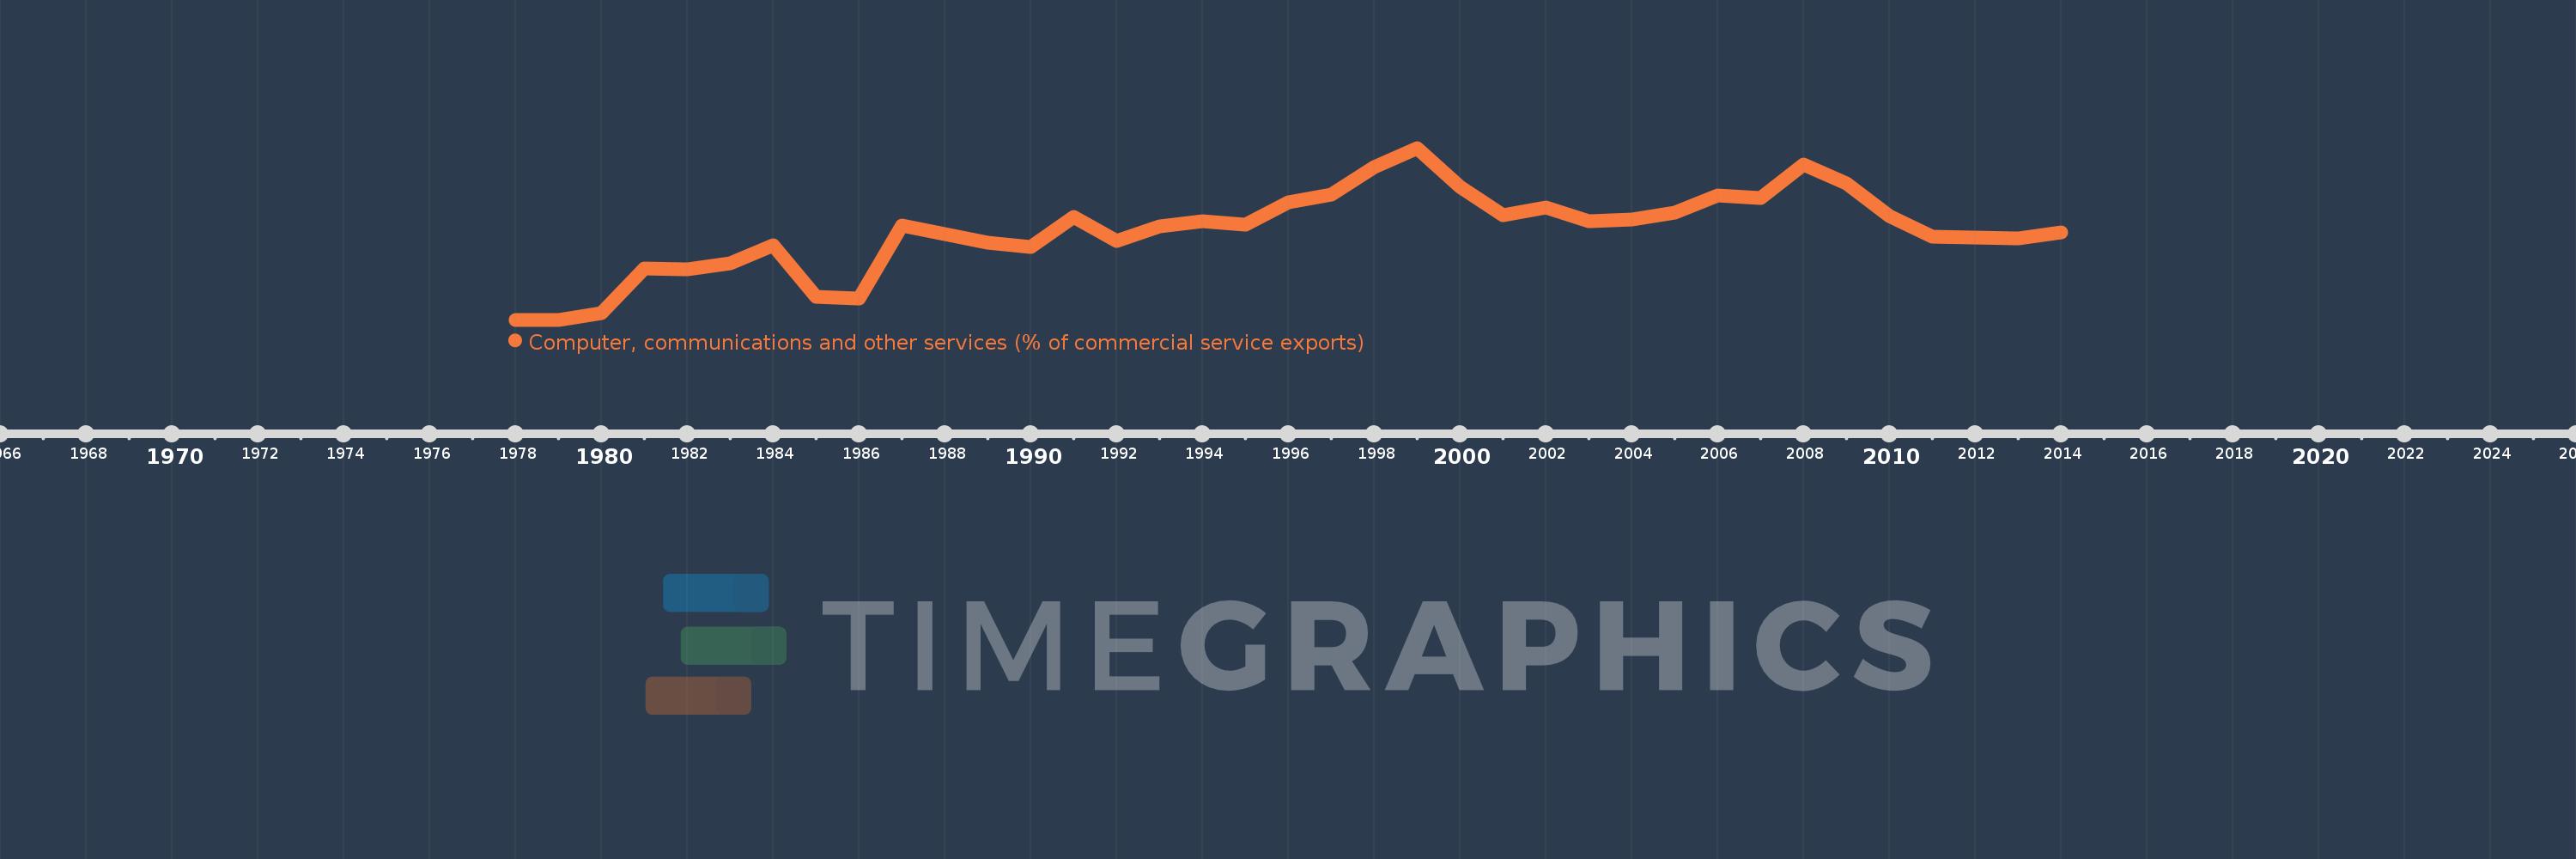
Computer, communications and other services (% of commercial service exports)
2014,2013,2012,2011,2010,2009,2008,2007,2006,2005,2004,2003,2002,2001,2000,1999,1998,1997,1996,1995,1994,1993,1992,1991,1990,1989,1988,1987,1986,1985,1984,1983,1982,1981,1980,1979,1978
Estas estadísticas en otros países:
AfghanistanAlbaniaAlgeriaAngolaAntigua and BarbudaArab WorldArgentinaArmeniaArubaAustraliaAustriaAzerbaijanBahamas, TheBahrainBangladeshBarbadosBelarusBelgiumBelizeBeninBermudaBhutanBoliviaBosnia and HerzegovinaBotswanaBrazilBrunei DarussalamBulgariaBurkina FasoBurundiCabo VerdeCambodiaCameroonCanadaCaribbean small statesCentral African RepublicCentral Europe and the BalticsChadChileChinaColombiaComorosCongo, Dem. Rep.Congo, Rep.Costa RicaCote d'IvoireCroatiaCuracaoCyprusCzech RepublicDenmarkDjiboutiDominicaDominican RepublicEarly-demographic dividendEast Asia & PacificEast Asia & Pacific (excluding high income)East Asia & Pacific (IDA & IBRD countries)EcuadorEgypt, Arab Rep.El SalvadorEritreaEstoniaEthiopiaEuro areaEurope & Central AsiaEurope & Central Asia (excluding high income)Europe & Central Asia (IDA & IBRD countries)European UnionFaroe IslandsFijiFinlandFragile and conflict affected situationsFranceFrench PolynesiaGabonGambia, TheGeorgiaGermanyGhanaGreeceGrenadaGuatemalaGuineaGuinea-BissauGuyanaHaitiHeavily indebted poor countries (HIPC)High incomeHondurasHong Kong SAR, ChinaHungaryIBRD onlyIcelandIDA & IBRD totalIDA onlyIDA totalIndiaIndonesiaIran, Islamic Rep.IraqIrelandIsraelItalyJamaicaJapanJordanKazakhstanKenyaKiribatiKorea, Rep.KosovoKuwaitKyrgyz RepublicLao PDRLate-demographic dividendLatin America & Caribbean Latin America & Caribbean (excluding high income)Latin America & the Caribbean (IDA & IBRD countries)LatviaLeast developed countries: UN classificationLebanonLesothoLiberiaLibyaLithuaniaLow & middle incomeLow incomeLower middle incomeLuxembourgMacao SAR, ChinaMacedonia, FYRMadagascarMalawiMalaysiaMaldivesMaliMaltaMarshall IslandsMauritaniaMauritiusMexicoMicronesia, Fed. Sts.Middle East & North AfricaMiddle East & North Africa (excluding high income)Middle East & North Africa (IDA & IBRD countries)Middle incomeMoldovaMongoliaMontenegroMoroccoMozambiqueMyanmarNamibiaNepalNetherlandsNew CaledoniaNew ZealandNicaraguaNigerNigeriaNorth AmericaNorwayOECD membersOmanOther small statesPacific island small statesPakistanPalauPanamaPapua New GuineaParaguayPeruPhilippinesPolandPortugalPost-demographic dividendPre-demographic dividendQatarRomaniaRussian FederationRwandaSamoaSao Tome and PrincipeSaudi ArabiaSenegalSerbiaSeychellesSierra LeoneSingaporeSint Maarten (Dutch part)Slovak RepublicSloveniaSmall statesSolomon IslandsSouth AfricaSouth AsiaSouth Asia (IDA & IBRD)South SudanSpainSri LankaSt. Kitts and NevisSt. LuciaSt. Vincent and the GrenadinesSub-Saharan Africa Sub-Saharan Africa (excluding high income)Sub-Saharan Africa (IDA & IBRD countries)SudanSurinameSwazilandSwedenSwitzerlandSyrian Arab RepublicTajikistanTanzaniaThailandTimor-LesteTogoTongaTrinidad and TobagoTunisiaTurkeyTuvaluUgandaUkraineUnited KingdomUnited StatesUpper middle incomeUruguayVanuatuVenezuela, RBWest Bank and GazaWorldYemen, Rep.ZambiaZimbabwe línea de tiempo (timeline):
En esta escala de tiempo se presenta un gráfico de 1978 y 2014 de Antigua and Barbuda. Los datos de 1977 están ausentes. El número de observaciones reales por fecha: 37.
Fuente (nombre):
Indicadores del desarrollo mundial
Fuente (organización):
International Monetary Fund, Balance of Payments Statistics Yearbook and data files.
Categorías:
Private Sector, Trade
Se ha actualizado:
23 abr 2017 año
Los indicadores de los cambios de valor en los últimos años
Máximo:
13.529
1 ene 1999 año
A la fecha de observación
Valor
Cambio absoluto
El cambio con respecto al valor anterior
1 ene 1978 año
0.0
0.0
0.0%
1 ene 1980 año
0.524
+0.524
%
1 ene 1981 año
4.036
+3.512
670.85%
1 ene 1982 año
4.0
-0.036
-0.89%
1 ene 1983 año
4.449
+0.449
11.22%
1 ene 1984 año
5.892
+1.443
32.44%
1 ene 1985 año
1.817
-4.075
-69.16%
1 ene 1986 año
1.663
-0.153
-8.45%
1 ene 1987 año
7.408
+5.745
345.4%
1 ene 1988 año
6.769
-0.64
-8.64%
1 ene 1989 año
6.04
-0.728
-10.76%
1 ene 1990 año
5.75
-0.291
-4.82%
1 ene 1991 año
8.116
+2.366
41.15%
1 ene 1992 año
6.219
-1.897
-23.37%
1 ene 1993 año
7.332
+1.113
17.91%
1 ene 1994 año
7.771
+0.439
5.99%
1 ene 1995 año
7.511
-0.261
-3.35%
1 ene 1996 año
9.261
+1.75
23.31%
1 ene 1997 año
9.827
+0.566
6.11%
1 ene 1998 año
12.004
+2.177
22.15%
1 ene 1999 año
13.529
+1.525
12.7%
1 ene 2000 año
10.469
-3.06
-22.62%
1 ene 2001 año
8.248
-2.222
-21.22%
1 ene 2002 año
8.851
+0.603
7.32%
1 ene 2003 año
7.738
-1.113
-12.58%
1 ene 2004 año
7.899
+0.162
2.09%
1 ene 2005 año
8.416
+0.517
6.54%
1 ene 2006 año
9.815
+1.399
16.62%
1 ene 2007 año
9.59
-0.225
-2.29%
1 ene 2008 año
12.196
+2.607
27.18%
1 ene 2009 año
10.74
-1.457
-11.95%
1 ene 2010 año
8.145
-2.594
-24.15%
1 ene 2011 año
6.52
-1.625
-19.95%
1 ene 2012 año
6.463
-0.057
-0.88%
1 ene 2013 año
6.417
-0.046
-0.71%
1 ene 2014 año
6.865
+0.448
6.98%
Ranking de los países por los datos estadísticos actuales


Comentarios: