29
/es/
es
AIzaSyAYiBZKx7MnpbEhh9jyipgxe19OcubqV5w
April 1, 2024
54638
Post-demographic dividend
PST
false
2
1
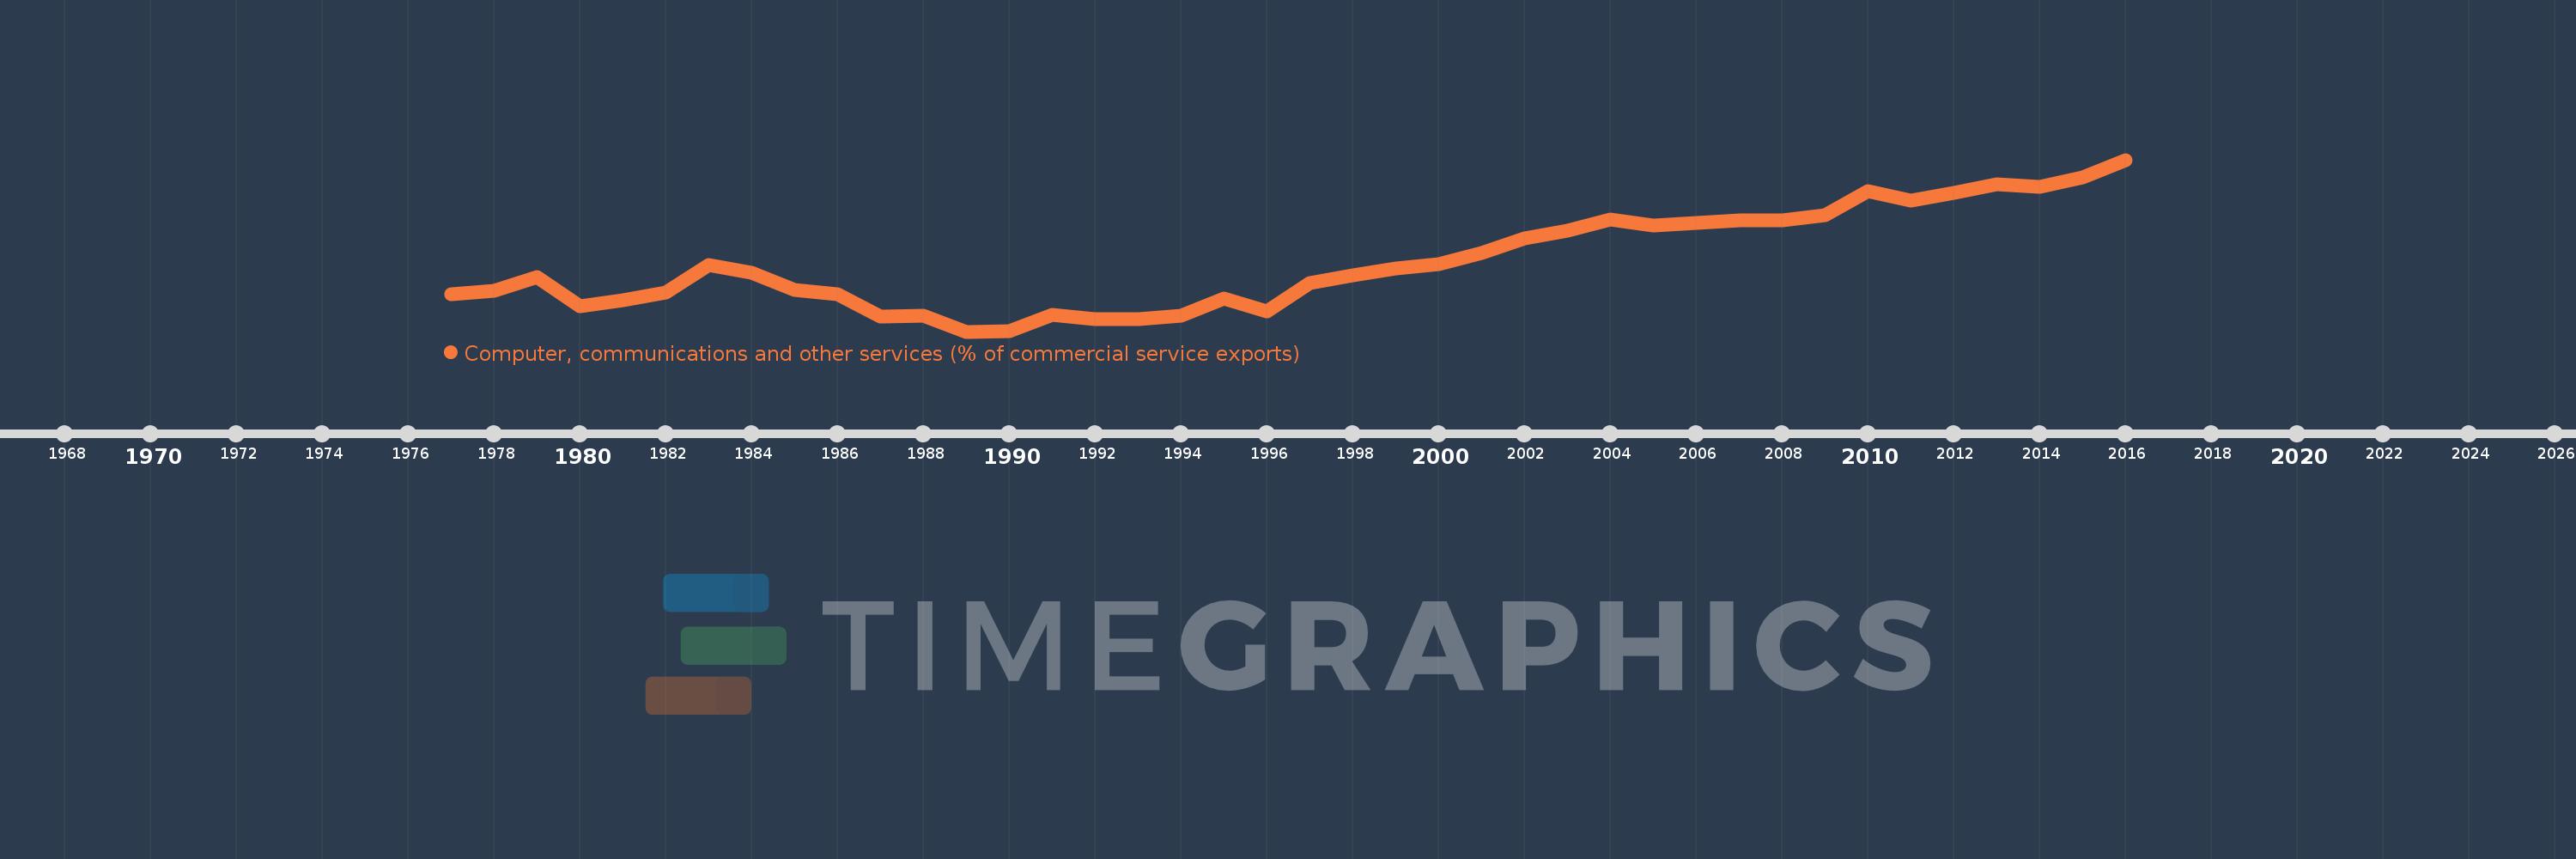
Computer, communications and other services (% of commercial service exports)
2016,2015,2014,2013,2012,2011,2010,2009,2008,2007,2006,2005,2004,2003,2002,2001,2000,1999,1998,1997,1996,1995,1994,1993,1992,1991,1990,1989,1988,1987,1986,1985,1984,1983,1982,1981,1980,1979,1978,1977
Estas estadísticas en otros países:
AfghanistanAlbaniaAlgeriaAngolaAntigua and BarbudaArab WorldArgentinaArmeniaArubaAustraliaAustriaAzerbaijanBahamas, TheBahrainBangladeshBarbadosBelarusBelgiumBelizeBeninBermudaBhutanBoliviaBosnia and HerzegovinaBotswanaBrazilBrunei DarussalamBulgariaBurkina FasoBurundiCabo VerdeCambodiaCameroonCanadaCaribbean small statesCentral African RepublicCentral Europe and the BalticsChadChileChinaColombiaComorosCongo, Dem. Rep.Congo, Rep.Costa RicaCote d'IvoireCroatiaCuracaoCyprusCzech RepublicDenmarkDjiboutiDominicaDominican RepublicEarly-demographic dividendEast Asia & PacificEast Asia & Pacific (excluding high income)East Asia & Pacific (IDA & IBRD countries)EcuadorEgypt, Arab Rep.El SalvadorEritreaEstoniaEthiopiaEuro areaEurope & Central AsiaEurope & Central Asia (excluding high income)Europe & Central Asia (IDA & IBRD countries)European UnionFaroe IslandsFijiFinlandFragile and conflict affected situationsFranceFrench PolynesiaGabonGambia, TheGeorgiaGermanyGhanaGreeceGrenadaGuatemalaGuineaGuinea-BissauGuyanaHaitiHeavily indebted poor countries (HIPC)High incomeHondurasHong Kong SAR, ChinaHungaryIBRD onlyIcelandIDA & IBRD totalIDA onlyIDA totalIndiaIndonesiaIran, Islamic Rep.IraqIrelandIsraelItalyJamaicaJapanJordanKazakhstanKenyaKiribatiKorea, Rep.KosovoKuwaitKyrgyz RepublicLao PDRLate-demographic dividendLatin America & Caribbean Latin America & Caribbean (excluding high income)Latin America & the Caribbean (IDA & IBRD countries)LatviaLeast developed countries: UN classificationLebanonLesothoLiberiaLibyaLithuaniaLow & middle incomeLow incomeLower middle incomeLuxembourgMacao SAR, ChinaMacedonia, FYRMadagascarMalawiMalaysiaMaldivesMaliMaltaMarshall IslandsMauritaniaMauritiusMexicoMicronesia, Fed. Sts.Middle East & North AfricaMiddle East & North Africa (excluding high income)Middle East & North Africa (IDA & IBRD countries)Middle incomeMoldovaMongoliaMontenegroMoroccoMozambiqueMyanmarNamibiaNepalNetherlandsNew CaledoniaNew ZealandNicaraguaNigerNigeriaNorth AmericaNorwayOECD membersOmanOther small statesPacific island small statesPakistanPalauPanamaPapua New GuineaParaguayPeruPhilippinesPolandPortugalPost-demographic dividendPre-demographic dividendQatarRomaniaRussian FederationRwandaSamoaSao Tome and PrincipeSaudi ArabiaSenegalSerbiaSeychellesSierra LeoneSingaporeSint Maarten (Dutch part)Slovak RepublicSloveniaSmall statesSolomon IslandsSouth AfricaSouth AsiaSouth Asia (IDA & IBRD)South SudanSpainSri LankaSt. Kitts and NevisSt. LuciaSt. Vincent and the GrenadinesSub-Saharan Africa Sub-Saharan Africa (excluding high income)Sub-Saharan Africa (IDA & IBRD countries)SudanSurinameSwazilandSwedenSwitzerlandSyrian Arab RepublicTajikistanTanzaniaThailandTimor-LesteTogoTongaTrinidad and TobagoTunisiaTurkeyTuvaluUgandaUkraineUnited KingdomUnited StatesUpper middle incomeUruguayVanuatuVenezuela, RBWest Bank and GazaWorldYemen, Rep.ZambiaZimbabwe línea de tiempo (timeline):
En esta escala de tiempo se presenta un gráfico de 1977 y 2016 de Post-demographic dividend. Los datos de 1976 están ausentes. El número de observaciones reales por fecha: 40.
Fuente (nombre):
Indicadores del desarrollo mundial
Fuente (organización):
International Monetary Fund, Balance of Payments Statistics Yearbook and data files.
Categorías:
Private Sector, Trade
Se ha actualizado:
23 abr 2017 año
Los indicadores de los cambios de valor en los últimos años
Mínimo:
31.816
1 ene 1989 año
Máximo:
48.47
1 ene 2016 año
A la fecha de observación
Valor
Cambio absoluto
El cambio con respecto al valor anterior
1 ene 1977 año
35.441
+35.441
0.0%
1 ene 1978 año
35.805
+0.364
1.03%
1 ene 1979 año
37.077
+1.272
3.55%
1 ene 1980 año
34.232
-2.844
-7.67%
1 ene 1981 año
34.878
+0.646
1.89%
1 ene 1982 año
35.625
+0.747
2.14%
1 ene 1983 año
38.268
+2.643
7.42%
1 ene 1984 año
37.545
-0.723
-1.89%
1 ene 1985 año
35.822
-1.722
-4.59%
1 ene 1986 año
35.479
-0.343
-0.96%
1 ene 1987 año
33.308
-2.171
-6.12%
1 ene 1988 año
33.34
+0.032
0.1%
1 ene 1989 año
31.816
-1.524
-4.57%
1 ene 1990 año
31.818
+0.001
0.0%
1 ene 1991 año
33.449
+1.631
5.13%
1 ene 1992 año
33.047
-0.402
-1.2%
1 ene 1993 año
33.061
+0.014
0.04%
1 ene 1994 año
33.367
+0.306
0.93%
1 ene 1995 año
35.055
+1.688
5.06%
1 ene 1996 año
33.783
-1.272
-3.63%
1 ene 1997 año
36.532
+2.749
8.14%
1 ene 1998 año
37.292
+0.76
2.08%
1 ene 1999 año
37.964
+0.672
1.8%
1 ene 2000 año
38.313
+0.349
0.92%
1 ene 2001 año
39.468
+1.155
3.01%
1 ene 2002 año
40.84
+1.372
3.48%
1 ene 2003 año
41.596
+0.756
1.85%
1 ene 2004 año
42.682
+1.087
2.61%
1 ene 2005 año
42.062
-0.62
-1.45%
1 ene 2006 año
42.339
+0.277
0.66%
1 ene 2007 año
42.623
+0.284
0.67%
1 ene 2008 año
42.631
+0.008
0.02%
1 ene 2009 año
43.106
+0.475
1.11%
1 ene 2010 año
45.398
+2.292
5.32%
1 ene 2011 año
44.476
-0.922
-2.03%
1 ene 2012 año
45.288
+0.812
1.83%
1 ene 2013 año
46.065
+0.777
1.71%
1 ene 2014 año
45.832
-0.233
-0.51%
1 ene 2015 año
46.787
+0.955
2.08%
1 ene 2016 año
48.47
+1.683
3.6%
Ranking de los países por los datos estadísticos actuales


Comentarios: