29
/es/
es
AIzaSyAYiBZKx7MnpbEhh9jyipgxe19OcubqV5w
April 1, 2024
262018
Thailand
THA
true
2
1
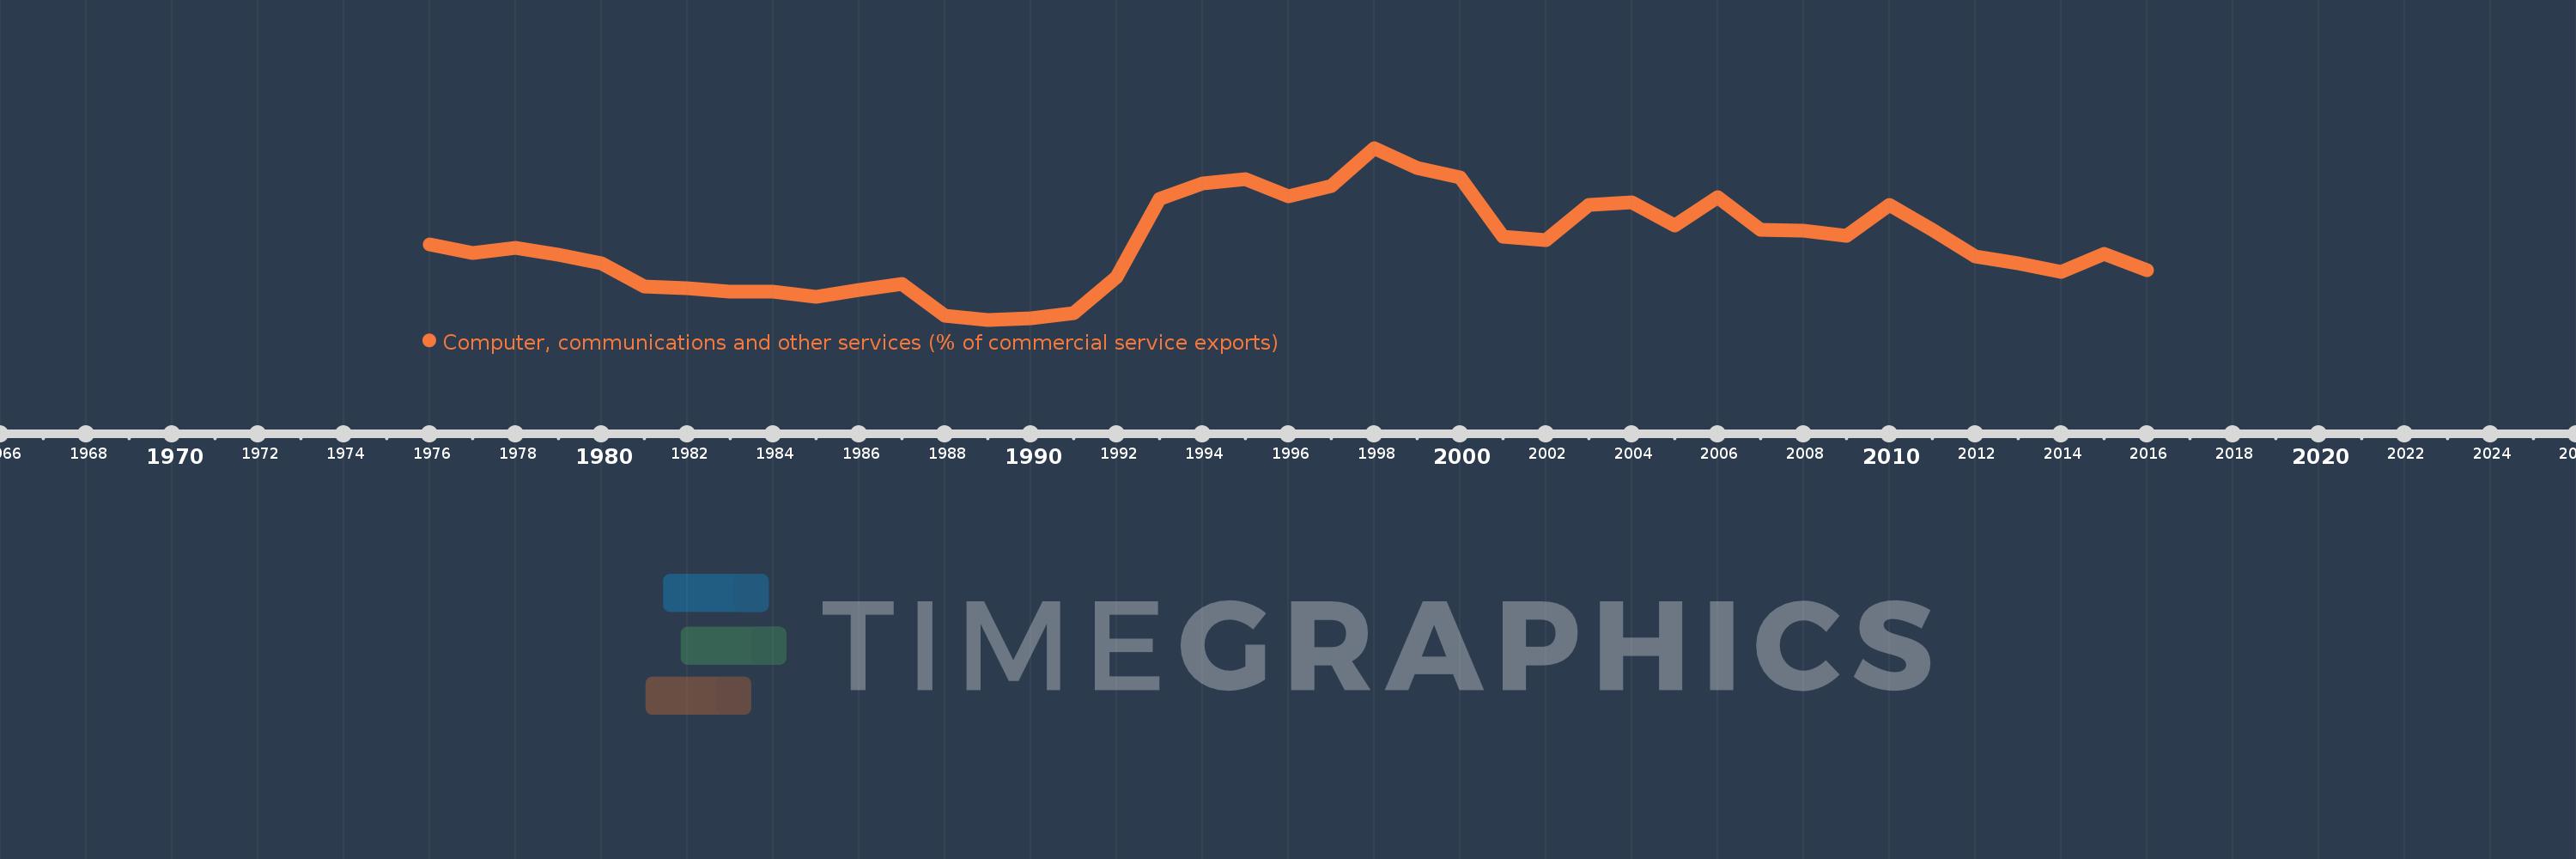
Computer, communications and other services (% of commercial service exports)
2016,2015,2014,2013,2012,2011,2010,2009,2008,2007,2006,2005,2004,2003,2002,2001,2000,1999,1998,1997,1996,1995,1994,1993,1992,1991,1990,1989,1988,1987,1986,1985,1984,1983,1982,1981,1980,1979,1978,1977,1976
Estas estadísticas en otros países:
AfghanistanAlbaniaAlgeriaAngolaAntigua and BarbudaArab WorldArgentinaArmeniaArubaAustraliaAustriaAzerbaijanBahamas, TheBahrainBangladeshBarbadosBelarusBelgiumBelizeBeninBermudaBhutanBoliviaBosnia and HerzegovinaBotswanaBrazilBrunei DarussalamBulgariaBurkina FasoBurundiCabo VerdeCambodiaCameroonCanadaCaribbean small statesCentral African RepublicCentral Europe and the BalticsChadChileChinaColombiaComorosCongo, Dem. Rep.Congo, Rep.Costa RicaCote d'IvoireCroatiaCuracaoCyprusCzech RepublicDenmarkDjiboutiDominicaDominican RepublicEarly-demographic dividendEast Asia & PacificEast Asia & Pacific (excluding high income)East Asia & Pacific (IDA & IBRD countries)EcuadorEgypt, Arab Rep.El SalvadorEritreaEstoniaEthiopiaEuro areaEurope & Central AsiaEurope & Central Asia (excluding high income)Europe & Central Asia (IDA & IBRD countries)European UnionFaroe IslandsFijiFinlandFragile and conflict affected situationsFranceFrench PolynesiaGabonGambia, TheGeorgiaGermanyGhanaGreeceGrenadaGuatemalaGuineaGuinea-BissauGuyanaHaitiHeavily indebted poor countries (HIPC)High incomeHondurasHong Kong SAR, ChinaHungaryIBRD onlyIcelandIDA & IBRD totalIDA onlyIDA totalIndiaIndonesiaIran, Islamic Rep.IraqIrelandIsraelItalyJamaicaJapanJordanKazakhstanKenyaKiribatiKorea, Rep.KosovoKuwaitKyrgyz RepublicLao PDRLate-demographic dividendLatin America & Caribbean Latin America & Caribbean (excluding high income)Latin America & the Caribbean (IDA & IBRD countries)LatviaLeast developed countries: UN classificationLebanonLesothoLiberiaLibyaLithuaniaLow & middle incomeLow incomeLower middle incomeLuxembourgMacao SAR, ChinaMacedonia, FYRMadagascarMalawiMalaysiaMaldivesMaliMaltaMarshall IslandsMauritaniaMauritiusMexicoMicronesia, Fed. Sts.Middle East & North AfricaMiddle East & North Africa (excluding high income)Middle East & North Africa (IDA & IBRD countries)Middle incomeMoldovaMongoliaMontenegroMoroccoMozambiqueMyanmarNamibiaNepalNetherlandsNew CaledoniaNew ZealandNicaraguaNigerNigeriaNorth AmericaNorwayOECD membersOmanOther small statesPacific island small statesPakistanPalauPanamaPapua New GuineaParaguayPeruPhilippinesPolandPortugalPost-demographic dividendPre-demographic dividendQatarRomaniaRussian FederationRwandaSamoaSao Tome and PrincipeSaudi ArabiaSenegalSerbiaSeychellesSierra LeoneSingaporeSint Maarten (Dutch part)Slovak RepublicSloveniaSmall statesSolomon IslandsSouth AfricaSouth AsiaSouth Asia (IDA & IBRD)South SudanSpainSri LankaSt. Kitts and NevisSt. LuciaSt. Vincent and the GrenadinesSub-Saharan Africa Sub-Saharan Africa (excluding high income)Sub-Saharan Africa (IDA & IBRD countries)SudanSurinameSwazilandSwedenSwitzerlandSyrian Arab RepublicTajikistanTanzaniaThailandTimor-LesteTogoTongaTrinidad and TobagoTunisiaTurkeyTuvaluUgandaUkraineUnited KingdomUnited StatesUpper middle incomeUruguayVanuatuVenezuela, RBWest Bank and GazaWorldYemen, Rep.ZambiaZimbabwe línea de tiempo (timeline):
En esta escala de tiempo se presenta un gráfico de 1976 y 2016 de Thailand. Los datos de 1975 están ausentes. El número de observaciones reales por fecha: 41.
Fuente (nombre):
Indicadores del desarrollo mundial
Fuente (organización):
International Monetary Fund, Balance of Payments Statistics Yearbook and data files.
Categorías:
Private Sector, Trade
Se ha actualizado:
23 abr 2017 año
Los indicadores de los cambios de valor en los últimos años
Mínimo:
8.948
1 ene 1989 año
Máximo:
35.023
1 ene 1998 año
A la fecha de observación
Valor
Cambio absoluto
El cambio con respecto al valor anterior
1 ene 1976 año
20.41
+20.41
0.0%
1 ene 1977 año
19.064
-1.347
-6.6%
1 ene 1978 año
19.881
+0.817
4.29%
1 ene 1979 año
18.859
-1.022
-5.14%
1 ene 1980 año
17.459
-1.399
-7.42%
1 ene 1981 año
14.049
-3.41
-19.53%
1 ene 1982 año
13.782
-0.267
-1.9%
1 ene 1983 año
13.168
-0.614
-4.46%
1 ene 1984 año
13.175
+0.007
0.06%
1 ene 1985 año
12.491
-0.684
-5.19%
1 ene 1986 año
13.5
+1.01
8.08%
1 ene 1987 año
14.34
+0.84
6.22%
1 ene 1988 año
9.562
-4.778
-33.32%
1 ene 1989 año
8.948
-0.614
-6.43%
1 ene 1990 año
9.137
+0.189
2.11%
1 ene 1991 año
10.008
+0.872
9.54%
1 ene 1992 año
15.415
+5.407
54.02%
1 ene 1993 año
27.281
+11.867
76.98%
1 ene 1994 año
29.604
+2.323
8.51%
1 ene 1995 año
30.329
+0.725
2.45%
1 ene 1996 año
27.732
-2.598
-8.56%
1 ene 1997 año
29.255
+1.523
5.49%
1 ene 1998 año
35.023
+5.768
19.72%
1 ene 1999 año
31.961
-3.063
-8.74%
1 ene 2000 año
30.539
-1.422
-4.45%
1 ene 2001 año
21.548
-8.991
-29.44%
1 ene 2002 año
20.971
-0.576
-2.67%
1 ene 2003 año
26.439
+5.468
26.07%
1 ene 2004 año
26.765
+0.326
1.23%
1 ene 2005 año
23.259
-3.506
-13.1%
1 ene 2006 año
27.608
+4.349
18.7%
1 ene 2007 año
22.659
-4.949
-17.93%
1 ene 2008 año
22.426
-0.233
-1.03%
1 ene 2009 año
21.664
-0.763
-3.4%
1 ene 2010 año
26.434
+4.77
22.02%
1 ene 2011 año
22.545
-3.889
-14.71%
1 ene 2012 año
18.494
-4.051
-17.97%
1 ene 2013 año
17.452
-1.042
-5.63%
1 ene 2014 año
16.255
-1.197
-6.86%
1 ene 2015 año
18.887
+2.632
16.19%
1 ene 2016 año
16.436
-2.45
-12.97%
Ranking de los países por los datos estadísticos actuales


Comentarios: