29
/es/
es
AIzaSyAYiBZKx7MnpbEhh9jyipgxe19OcubqV5w
April 1, 2024
67785
Angola
AGO
true
2
1
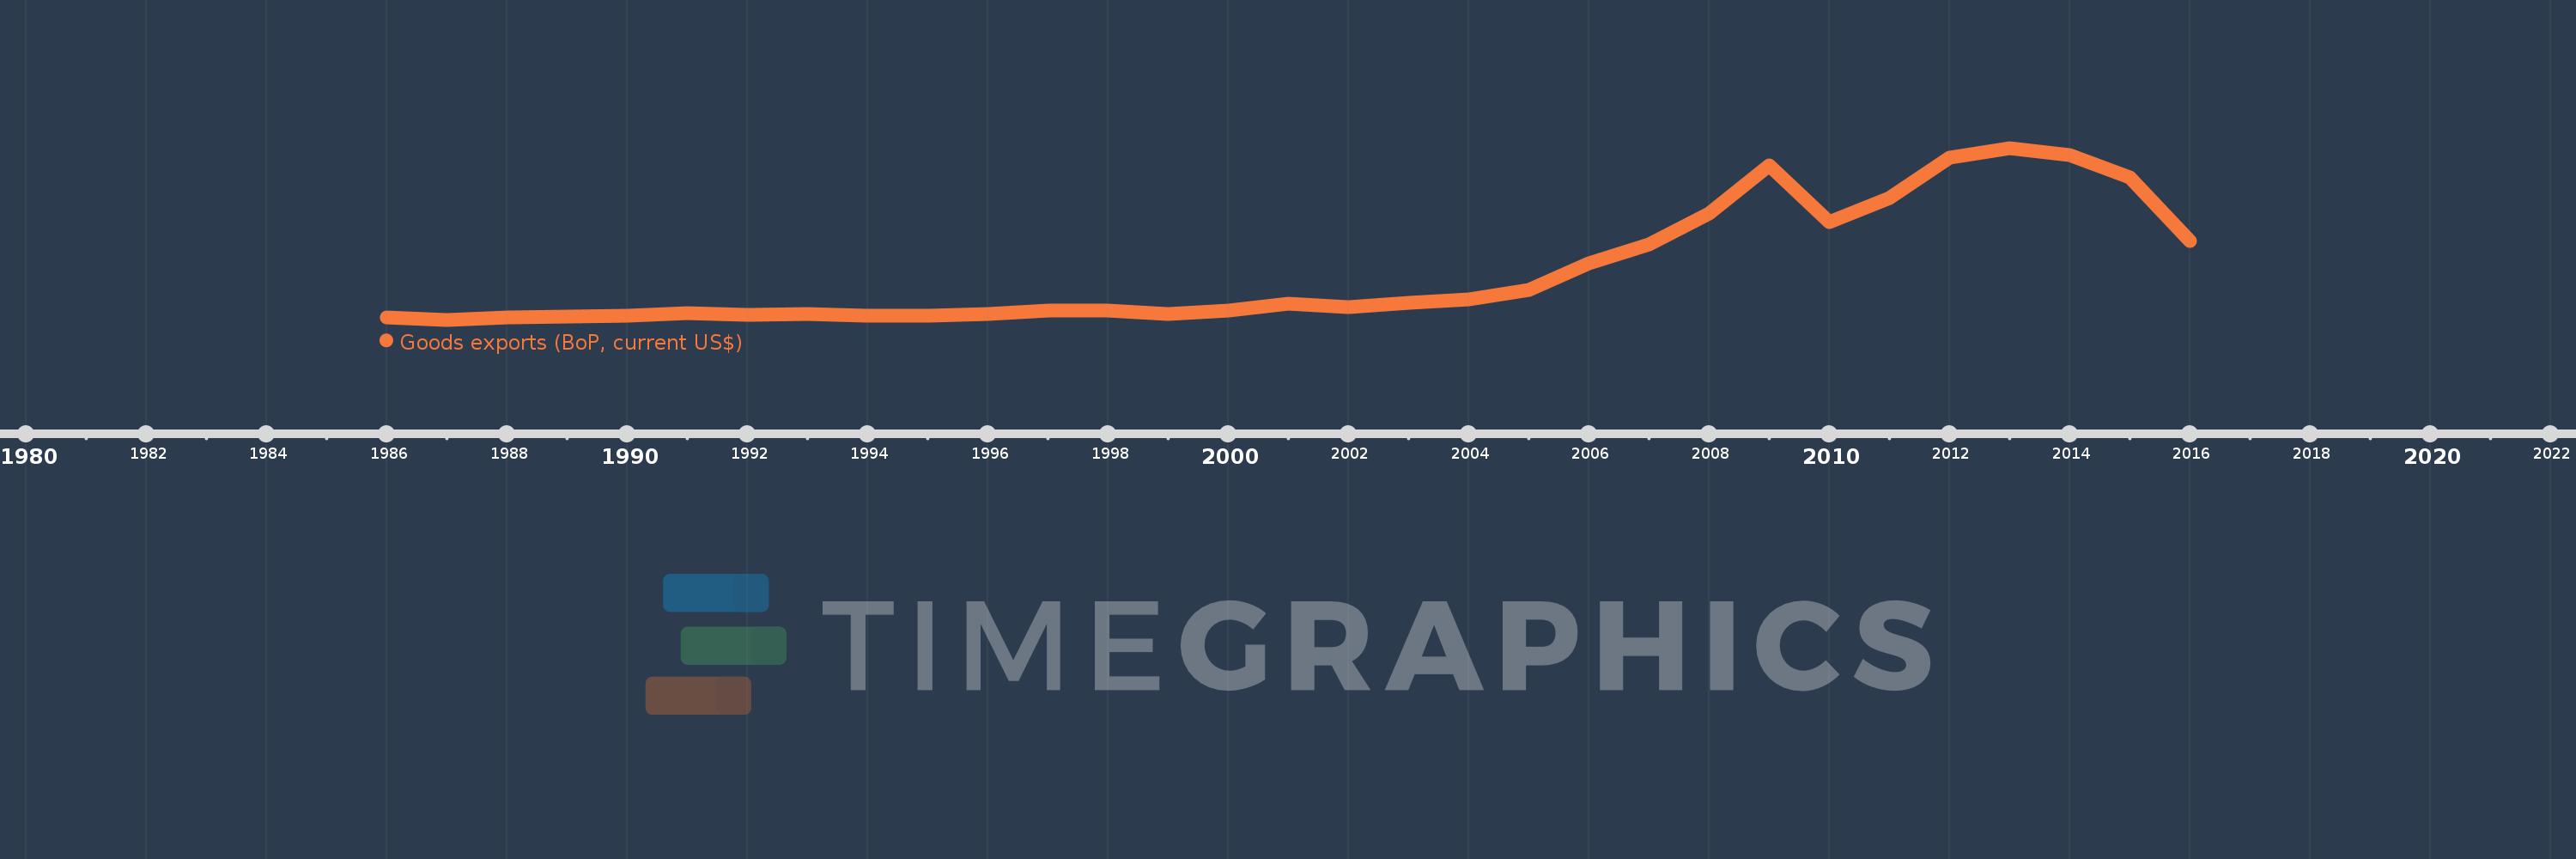
Goods exports (BoP, current US$)
2016,2015,2014,2013,2012,2011,2010,2009,2008,2007,2006,2005,2004,2003,2002,2001,2000,1999,1998,1997,1996,1995,1994,1993,1992,1991,1990,1989,1988,1987,1986
Estas estadísticas en otros países:
AfghanistanAlbaniaAlgeriaAngolaAntigua and BarbudaArab WorldArgentinaArmeniaArubaAustraliaAustriaAzerbaijanBahamas, TheBahrainBangladeshBarbadosBelarusBelgiumBelizeBeninBermudaBhutanBoliviaBosnia and HerzegovinaBotswanaBrazilBrunei DarussalamBulgariaBurkina FasoBurundiCabo VerdeCambodiaCameroonCanadaCaribbean small statesCentral African RepublicCentral Europe and the BalticsChadChileChinaColombiaComorosCongo, Dem. Rep.Congo, Rep.Costa RicaCote d'IvoireCroatiaCuracaoCyprusCzech RepublicDenmarkDjiboutiDominicaDominican RepublicEarly-demographic dividendEast Asia & PacificEast Asia & Pacific (excluding high income)East Asia & Pacific (IDA & IBRD countries)EcuadorEgypt, Arab Rep.El SalvadorEquatorial GuineaEritreaEstoniaEthiopiaEuro areaEurope & Central AsiaEurope & Central Asia (excluding high income)Europe & Central Asia (IDA & IBRD countries)European UnionFaroe IslandsFijiFinlandFragile and conflict affected situationsFranceFrench PolynesiaGabonGambia, TheGeorgiaGermanyGhanaGreeceGrenadaGuatemalaGuineaGuinea-BissauGuyanaHaitiHeavily indebted poor countries (HIPC)High incomeHondurasHong Kong SAR, ChinaHungaryIBRD onlyIcelandIDA & IBRD totalIDA blendIDA onlyIDA totalIndiaIndonesiaIran, Islamic Rep.IraqIrelandIsraelItalyJamaicaJapanJordanKazakhstanKenyaKiribatiKorea, Rep.KosovoKuwaitKyrgyz RepublicLao PDRLate-demographic dividendLatin America & Caribbean Latin America & Caribbean (excluding high income)Latin America & the Caribbean (IDA & IBRD countries)LatviaLeast developed countries: UN classificationLebanonLesothoLiberiaLibyaLithuaniaLow & middle incomeLow incomeLower middle incomeLuxembourgMacao SAR, ChinaMacedonia, FYRMadagascarMalawiMalaysiaMaldivesMaliMaltaMarshall IslandsMauritaniaMauritiusMexicoMicronesia, Fed. Sts.Middle East & North Africa (excluding high income)Middle East & North Africa (IDA & IBRD countries)Middle incomeMoldovaMongoliaMontenegroMoroccoMozambiqueMyanmarNamibiaNepalNetherlandsNew CaledoniaNew ZealandNicaraguaNigerNigeriaNorth AmericaNorwayOECD membersOmanPacific island small statesPakistanPalauPanamaPapua New GuineaParaguayPeruPhilippinesPolandPortugalPost-demographic dividendPre-demographic dividendQatarRomaniaRussian FederationRwandaSamoaSao Tome and PrincipeSaudi ArabiaSenegalSerbiaSeychellesSierra LeoneSingaporeSint Maarten (Dutch part)Slovak RepublicSloveniaSolomon IslandsSouth AfricaSouth AsiaSouth Asia (IDA & IBRD)South SudanSpainSri LankaSt. Kitts and NevisSt. LuciaSt. Vincent and the GrenadinesSub-Saharan Africa Sub-Saharan Africa (excluding high income)Sub-Saharan Africa (IDA & IBRD countries)SudanSurinameSwazilandSwedenSwitzerlandSyrian Arab RepublicTajikistanTanzaniaThailandTimor-LesteTogoTongaTrinidad and TobagoTunisiaTurkeyTuvaluUgandaUkraineUnited KingdomUnited StatesUpper middle incomeUruguayVanuatuVenezuela, RBVietnamWest Bank and GazaWorldYemen, Rep.ZambiaZimbabwe línea de tiempo (timeline):
En esta escala de tiempo se presenta un gráfico de 1986 y 2016 de Angola. Los datos de 1985 están ausentes. El número de observaciones reales por fecha: 31.
Fuente (nombre):
Indicadores del desarrollo mundial
Fuente (organización):
International Monetary Fund, Balance of Payments Statistics Yearbook and data files.
Categorías:
Economy & Growth, Trade
Se ha actualizado:
23 abr 2017 año
Los indicadores de los cambios de valor en los últimos años
Mínimo:
1.346 bn
1 ene 1987 año
Máximo:
71.093 bn
1 ene 2013 año
A la fecha de observación
Valor
Cambio absoluto
El cambio con respecto al valor anterior
1 ene 1986 año
2.301 bn
+2.301 bn
0.0%
1 ene 1987 año
1.346 bn
-955.0 millones
-41.5%
1 ene 1988 año
2.322 bn
+976.0 millones
72.51%
1 ene 1989 año
2.492 bn
+170.0 millones
7.32%
1 ene 1990 año
3.014 bn
+522.0 millones
20.95%
1 ene 1991 año
3.884 bn
+869.9 millones
28.86%
1 ene 1992 año
3.449 bn
-434.6 millones
-11.19%
1 ene 1993 año
3.833 bn
+383.5 millones
11.12%
1 ene 1994 año
2.901 bn
-932.3 millones
-24.32%
1 ene 1995 año
3.017 bn
+116.1 millones
4.0%
1 ene 1996 año
3.723 bn
+706.1 millones
23.41%
1 ene 1997 año
5.095 bn
+1.372 bn
36.86%
1 ene 1998 año
5.007 bn
-88.24 millones
-1.73%
1 ene 1999 año
3.543 bn
-1.464 bn
-29.24%
1 ene 2000 año
5.157 bn
+1.614 bn
45.55%
1 ene 2001 año
7.921 bn
+2.764 bn
53.61%
1 ene 2002 año
6.534 bn
-1.386 bn
-17.5%
1 ene 2003 año
8.328 bn
+1.794 bn
27.45%
1 ene 2004 año
9.508 bn
+1.18 bn
14.17%
1 ene 2005 año
13.475 bn
+3.967 bn
41.72%
1 ene 2006 año
24.109 bn
+10.634 bn
78.92%
1 ene 2007 año
31.862 bn
+7.753 bn
32.16%
1 ene 2008 año
44.396 bn
+12.534 bn
39.34%
1 ene 2009 año
63.914 bn
+19.518 bn
43.96%
1 ene 2010 año
40.828 bn
-23.086 bn
-36.12%
1 ene 2011 año
50.595 bn
+9.767 bn
23.92%
1 ene 2012 año
67.31 bn
+16.715 bn
33.04%
1 ene 2013 año
71.093 bn
+3.783 bn
5.62%
1 ene 2014 año
68.247 bn
-2.847 bn
-4.0%
1 ene 2015 año
59.17 bn
-9.077 bn
-13.3%
1 ene 2016 año
33.181 bn
-25.989 bn
-43.92%
Ranking de los países por los datos estadísticos actuales


Comentarios: