29
/es/
es
AIzaSyAYiBZKx7MnpbEhh9jyipgxe19OcubqV5w
April 1, 2024
26537
Early-demographic dividend
EAR
false
2
1
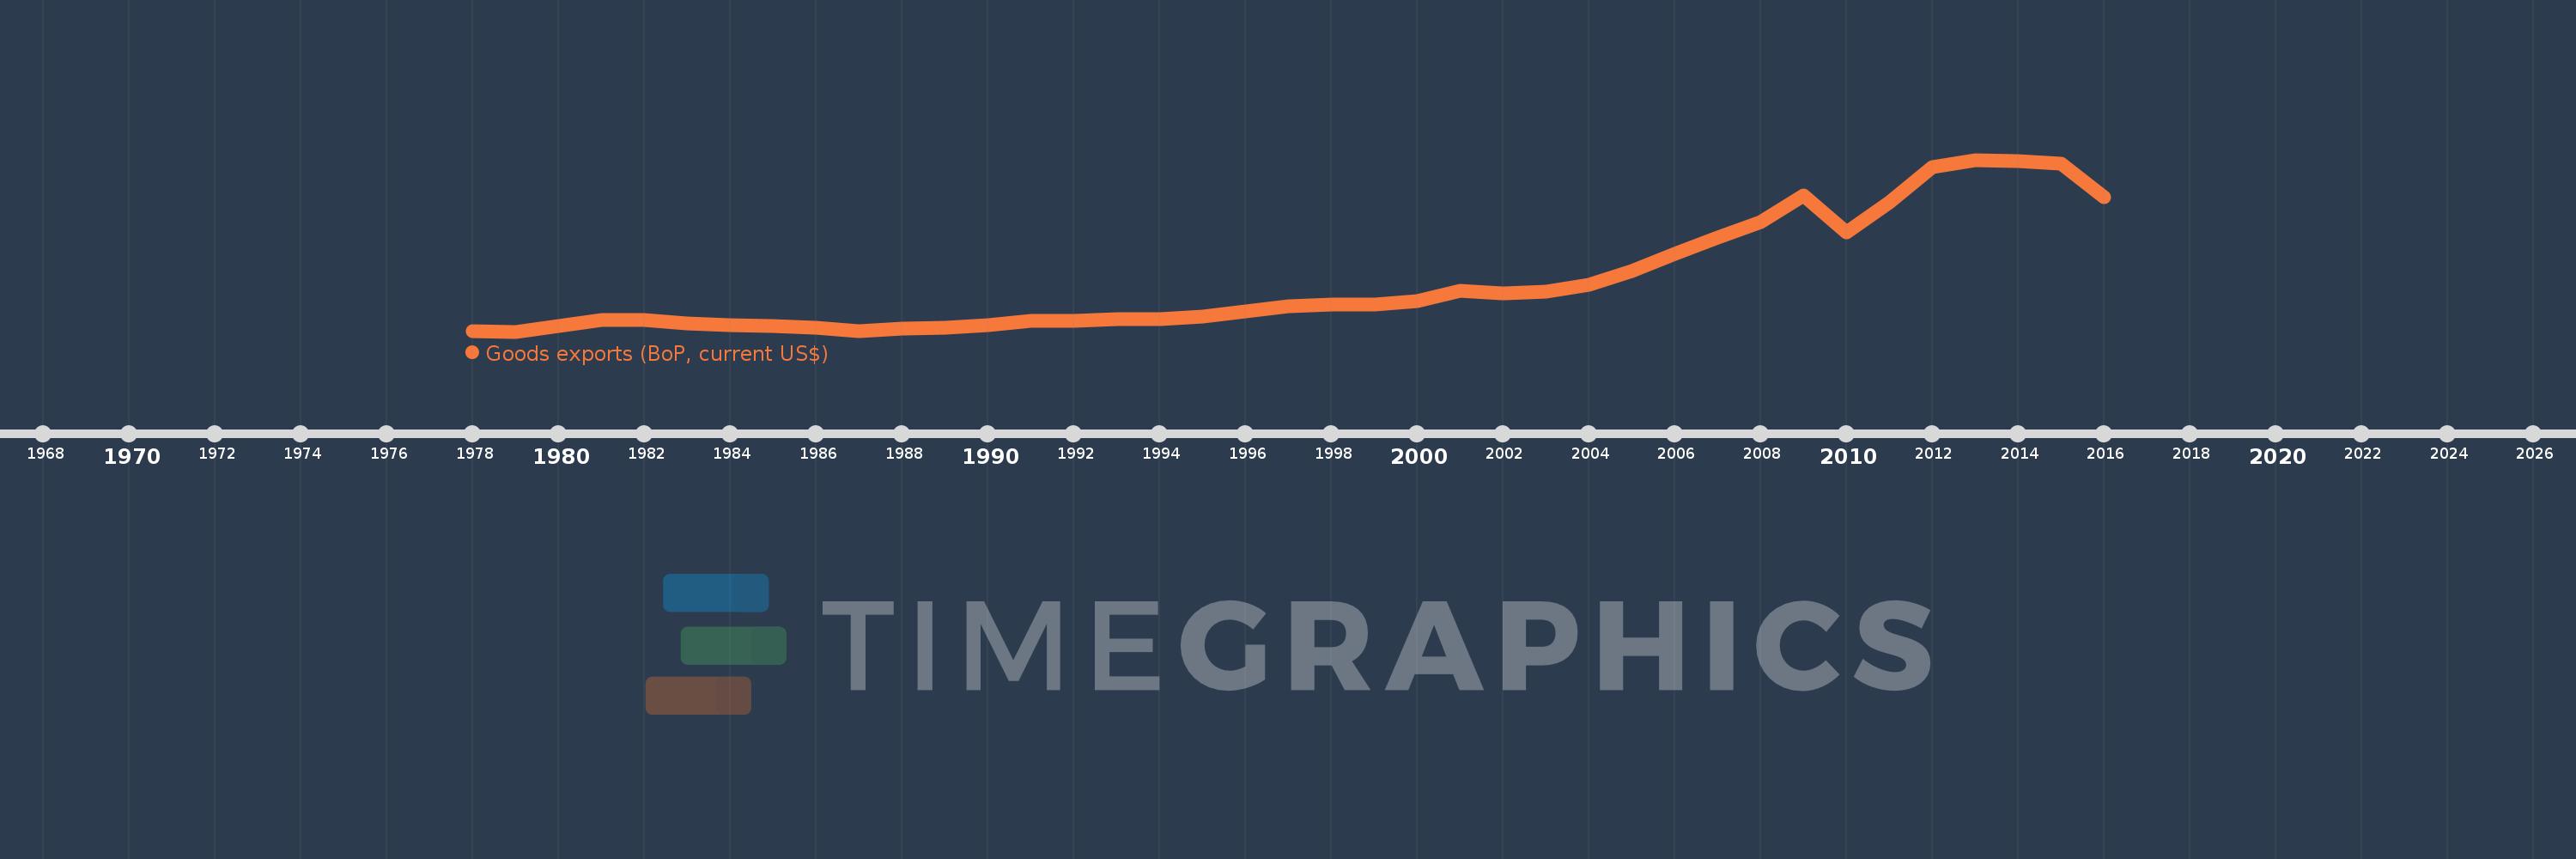
Goods exports (BoP, current US$)
2016,2015,2014,2013,2012,2011,2010,2009,2008,2007,2006,2005,2004,2003,2002,2001,2000,1999,1998,1997,1996,1995,1994,1993,1992,1991,1990,1989,1988,1987,1986,1985,1984,1983,1982,1981,1980,1979,1978
Estas estadísticas en otros países:
AfghanistanAlbaniaAlgeriaAngolaAntigua and BarbudaArab WorldArgentinaArmeniaArubaAustraliaAustriaAzerbaijanBahamas, TheBahrainBangladeshBarbadosBelarusBelgiumBelizeBeninBermudaBhutanBoliviaBosnia and HerzegovinaBotswanaBrazilBrunei DarussalamBulgariaBurkina FasoBurundiCabo VerdeCambodiaCameroonCanadaCaribbean small statesCentral African RepublicCentral Europe and the BalticsChadChileChinaColombiaComorosCongo, Dem. Rep.Congo, Rep.Costa RicaCote d'IvoireCroatiaCuracaoCyprusCzech RepublicDenmarkDjiboutiDominicaDominican RepublicEarly-demographic dividendEast Asia & PacificEast Asia & Pacific (excluding high income)East Asia & Pacific (IDA & IBRD countries)EcuadorEgypt, Arab Rep.El SalvadorEquatorial GuineaEritreaEstoniaEthiopiaEuro areaEurope & Central AsiaEurope & Central Asia (excluding high income)Europe & Central Asia (IDA & IBRD countries)European UnionFaroe IslandsFijiFinlandFragile and conflict affected situationsFranceFrench PolynesiaGabonGambia, TheGeorgiaGermanyGhanaGreeceGrenadaGuatemalaGuineaGuinea-BissauGuyanaHaitiHeavily indebted poor countries (HIPC)High incomeHondurasHong Kong SAR, ChinaHungaryIBRD onlyIcelandIDA & IBRD totalIDA blendIDA onlyIDA totalIndiaIndonesiaIran, Islamic Rep.IraqIrelandIsraelItalyJamaicaJapanJordanKazakhstanKenyaKiribatiKorea, Rep.KosovoKuwaitKyrgyz RepublicLao PDRLate-demographic dividendLatin America & Caribbean Latin America & Caribbean (excluding high income)Latin America & the Caribbean (IDA & IBRD countries)LatviaLeast developed countries: UN classificationLebanonLesothoLiberiaLibyaLithuaniaLow & middle incomeLow incomeLower middle incomeLuxembourgMacao SAR, ChinaMacedonia, FYRMadagascarMalawiMalaysiaMaldivesMaliMaltaMarshall IslandsMauritaniaMauritiusMexicoMicronesia, Fed. Sts.Middle East & North Africa (excluding high income)Middle East & North Africa (IDA & IBRD countries)Middle incomeMoldovaMongoliaMontenegroMoroccoMozambiqueMyanmarNamibiaNepalNetherlandsNew CaledoniaNew ZealandNicaraguaNigerNigeriaNorth AmericaNorwayOECD membersOmanPacific island small statesPakistanPalauPanamaPapua New GuineaParaguayPeruPhilippinesPolandPortugalPost-demographic dividendPre-demographic dividendQatarRomaniaRussian FederationRwandaSamoaSao Tome and PrincipeSaudi ArabiaSenegalSerbiaSeychellesSierra LeoneSingaporeSint Maarten (Dutch part)Slovak RepublicSloveniaSolomon IslandsSouth AfricaSouth AsiaSouth Asia (IDA & IBRD)South SudanSpainSri LankaSt. Kitts and NevisSt. LuciaSt. Vincent and the GrenadinesSub-Saharan Africa Sub-Saharan Africa (excluding high income)Sub-Saharan Africa (IDA & IBRD countries)SudanSurinameSwazilandSwedenSwitzerlandSyrian Arab RepublicTajikistanTanzaniaThailandTimor-LesteTogoTongaTrinidad and TobagoTunisiaTurkeyTuvaluUgandaUkraineUnited KingdomUnited StatesUpper middle incomeUruguayVanuatuVenezuela, RBVietnamWest Bank and GazaWorldYemen, Rep.ZambiaZimbabwe línea de tiempo (timeline):
En esta escala de tiempo se presenta un gráfico de 1978 y 2016 de Early-demographic dividend. Los datos de 1977 están ausentes. El número de observaciones reales por fecha: 39.
Fuente (nombre):
Indicadores del desarrollo mundial
Fuente (organización):
International Monetary Fund, Balance of Payments Statistics Yearbook and data files.
Categorías:
Economy & Growth, Trade
Se ha actualizado:
23 abr 2017 año
Los indicadores de los cambios de valor en los últimos años
Mínimo:
160.865 bn
1 ene 1979 año
Máximo:
2.432 billones
1 ene 2013 año
A la fecha de observación
Valor
Cambio absoluto
El cambio con respecto al valor anterior
1 ene 1978 año
166.626 bn
+166.626 bn
0.0%
1 ene 1979 año
160.865 bn
-5.76 bn
-3.46%
1 ene 1980 año
229.41 bn
+68.545 bn
42.61%
1 ene 1981 año
310.271 bn
+80.861 bn
35.25%
1 ene 1982 año
318.401 bn
+8.129 bn
2.62%
1 ene 1983 año
272.898 bn
-45.503 bn
-14.29%
1 ene 1984 año
240.392 bn
-32.506 bn
-11.91%
1 ene 1985 año
234.223 bn
-6.169 bn
-2.57%
1 ene 1986 año
212.902 bn
-21.321 bn
-9.1%
1 ene 1987 año
170.863 bn
-42.039 bn
-19.75%
1 ene 1988 año
204.73 bn
+33.867 bn
19.82%
1 ene 1989 año
216.082 bn
+11.352 bn
5.54%
1 ene 1990 año
243.609 bn
+27.528 bn
12.74%
1 ene 1991 año
303.239 bn
+59.63 bn
24.48%
1 ene 1992 año
305.755 bn
+2.516 bn
0.83%
1 ene 1993 año
323.578 bn
+17.823 bn
5.83%
1 ene 1994 año
329.634 bn
+6.055 bn
1.87%
1 ene 1995 año
362.473 bn
+32.839 bn
9.96%
1 ene 1996 año
432.415 bn
+69.941 bn
19.3%
1 ene 1997 año
493.221 bn
+60.806 bn
14.06%
1 ene 1998 año
519.044 bn
+25.824 bn
5.24%
1 ene 1999 año
522.367 bn
+3.323 bn
0.64%
1 ene 2000 año
560.716 bn
+38.349 bn
7.34%
1 ene 2001 año
701.337 bn
+140.621 bn
25.08%
1 ene 2002 año
662.052 bn
-39.285 bn
-5.6%
1 ene 2003 año
689.455 bn
+27.403 bn
4.14%
1 ene 2004 año
782.928 bn
+93.473 bn
13.56%
1 ene 2005 año
957.96 bn
+175.033 bn
22.36%
1 ene 2006 año
1.186 billones
+228.148 bn
23.82%
1 ene 2007 año
1.405 billones
+219.352 bn
18.49%
1 ene 2008 año
1.604 billones
+199.037 bn
14.16%
1 ene 2009 año
1.957 billones
+352.089 bn
21.94%
1 ene 2010 año
1.47 billones
-486.919 bn
-24.89%
1 ene 2011 año
1.87 billones
+400.777 bn
27.27%
1 ene 2012 año
2.331 billones
+460.405 bn
24.61%
1 ene 2013 año
2.432 billones
+100.842 bn
4.33%
1 ene 2014 año
2.409 billones
-22.56 bn
-0.93%
1 ene 2015 año
2.376 billones
-32.735 bn
-1.36%
1 ene 2016 año
1.932 billones
-443.904 bn
-18.68%
Ranking de los países por los datos estadísticos actuales


Comentarios: